Research Article
Abdulhameed Abana Girei ![]() 1 , Muhammad Attahiru Ndanitsa2, Ernest Ogezi1, Muhammad Ibrahim Imam1
1 , Muhammad Attahiru Ndanitsa2, Ernest Ogezi1, Muhammad Ibrahim Imam1
1Department of Agricultural Economics & Extension, Faculty of Agriculture, Nasarawa State University, Keffi, Nigeria
2Department of Agricultural Economics & Extension Technology, School of Agriculture & Agricultural Technology, Federal University of Technology, Minna, Niger State, Nigeria
Abstract. Fish marketing is gaining prominence especially in the rural communities as an all year-round poverty alleviation micro-enterprise requiring low capital base. This study examined the marketing performance of smoked and fresh fish in the study area. Primary data were obtained from 80 respondents selected through a two-stage sampling technique. Data were analysed using descriptive and inferential statistics. The objectives of the study were to: describe and compare the market structure and performance, determine the profitability, identify marketing intermediaries, and constraints to smoked and fresh fish marketing in the study area. The results showed that that both sexes involved in fish marketing with the female (58.7%) dominating. Majority (67.5%) of the marketers were within the age group of 15–44 years. The mean age was 33 years. Also, 73.7% of the respondents were married and most (58.7%) of the respondents had household size of between 1 and 5 persons and the mean household size was 6 persons. About 65% of the respondents had one form of education or the other. The mean fish marketing experience was estimated at 15 years. The benefit cost ratio for fresh fish marketing was ₦0.26. This implies that ₦0.26 was made for every ₦1 invested in the fresh fish business and the marketing efficiency for fresh fish marketing was calculated at 2.93 (293%), while the net benefit cost ratio of smoked fish was calculated at ₦1.57. This implies that ₦0.57 was made on every ₦1 invested into the smoked fish enterprise. The results further indicated significant revenue differential between smoked fish (₦380,500.00) and fresh fish (₦179,640.00) of ₦200,860.00. This accounted for about 111.82% indicating that smoked fish marketing yields higher revenue than fresh fish, in the study area. The Gini-coefficient (GC) for both fresh and smoked fish marketers were calculated at 0.5857 and 0.4801 respectively. Decentralized routes of marketing channels were observed with retailers having the highest percentage of 32.5 for the traded smoked fish, while consumers had the highest (30.0%) of the traded fresh fish. Some of the identified constraints include; seasonality, inadequate credit, poor storage facilities and poor road networks. It was recommended that the marketers organize themselves into cooperative organizations and set up strong market networks and linkages in order to benefit from available markets outside their immediate vicinities.
Keywords: Comparative analysis, marketing, fish
Fish is one of the most important sources of food and income to many people in developing countries. The demand for fish globally and particularly in Nigeria has been on the increase with supplies not meeting up the demand [FAO 2012FAO (2012). Production, accessibility, marketing and consumption patterns of freshwater aquaculture products in Asia: a cross-country comparison. http//www.fao.org/fishery/aquaculture. Google Scholar]. Nigeria’s annual fish demand is 2.7 million tonnes with local production standing at 0.8 million metric tonnes and a 1.9 million metric tonnes deficit supplied through imports and worth about \$1.2 billion [Ewepu 2019Ewepu, G. (2019). Nigeria needs no fish importation – Fish farmers. https://www.vanguardngr.com/2019/09/nigeria-needs-no-fish-importation-fish-farmers/. Google Scholar]. Fisheries production is essential to the economic well-being of millions of rural people in the developing world. Aquaculture provides direct employment for some 200 million people, the vast majority of whom work in the traditional small-scale sector, which account for about 70% of fisheries production [FAO 2008FAO (2008). Fisheries: gender discrimination is perpetuated in women's limited access to credit, Storage facilities and Training.. Google Scholar]. Despite the popularity of farming in Nigeria, the fish farming industry can be described as being at the infant stage when compared to the large market potential for its production and market [Nwiro 2012Nwiro, E. (2012). Fish farming: a lucrative business. Accessed on line 20th October 2012. http//www.thisdaylive.com/articules/fish-farming-alucrative business/119253/. Google Scholar]. Fish is also one of the important animal protein foods available in Nigeria. About a decade ago fish constituted 40% of animal protein intake [Atanda 2009Atanda, A.N. (2009). Freshwater fish seed resources in Nigeria. Fish Network, 5(4), 26–57. Google Scholar]. The demand for such protein is rising exponentially with the rapidly accelerating increases in human population. Fish is available in the market in different forms like fresh, frozen, canned, smoked, dried, fried, and cooked form [Mshelia et al. 2007Mshelia, Y.B., Bankole, N.O., Omorinkoba, W.S., Musa, Y.M., Tafida, A.A. Richard, L.M. Ago, N.D., Adedeji, R.B. (2007). The marketing and distribution of fish in New Bussa fish market area of Niger State. In: 22nd annual Conference of the Fisheries Society of Nigeria (FISON), 12–16 Nov. 2007, Kebbi, Nigeria, 172–178. Google Scholar]. The fisheries sub-sector represents a major food source due majorly for the protein they provide and the industrial products they produce. As a prime source of protein, fish is culturally, economically and socially important as a global dietary aspects sustainable food security. Economically, fish serves as an im-portant source of food and income for both men and women and fishing as a trade has an important social and cultural position in not only riverine communities but in most of the society. Therefore, availability of fish to the consumers at the right time, form, and place and at the lowest possible cost generally requires an effective and efficient marketing system [Polycarp et al. 2015Polycarp, M., Adebayo, E.F., Tafida, A.A., Amurtiya, M. (2015). Comparative analysis of processed and fresh fish marketing Yola North and Girei Local Government Areas of Adamawa State, Nigeria. Int. J. Sci. Technol., 3(7), 187–191. Google Scholar].
The term fish is a diverse group of animals that live and breathe in water by means of gills. Fish is one of the most diverse groups of animals known to man with over two thousand five hundred species. There are more species of fish than all other vertebrate [Eyo 2001Eyo, A.A. (2001). Fish processing technology in the tropics, University of Ilorin Press, Ilorin, Kwara State, Nigeria.. Google Scholar]. The fishery sector is estimated to contribute about 3.5% to Nigeria’s Gross Domestic Product (GDP), and also provides direct and indirect employment to over six million people [Kwara State Government 2010Kwara State Government (2010). Fish Farming Opportunities in Nigeria. A publication of Kwara State Government, Nigeria. Google Scholar]. The employment opportunities come from different fishing activities such as production, processing, preservation and transportation [Ali et al. 2008Ali, E.A., Gaya, H.I.M., Jampada, T.N. (2008). Economic analysis of fresh fish marketing in Maiduguri Gamboru Market and Kachallari Alau Dam landing site of North Eastern Nigeria. J. Agric. Sci., 4(1), 23–26. Google Scholar]. The Central Bank of Nigeria [CBN 2005CBN (2005). Microfinance Policy, Regulatory and Supervisory Framework for Nigeria. Central Bank of Nigeria, Abuja. Google Scholar] report shows that the contribution of the fishery sector to the GDP of Nigeria rose from ₦76.76 billion in 2001 to ₦162.61 billion in 2005 indicating an increased by ₦85.85 billion and this accounted for 111.84 percent.
In West Africa fish accounts for 30% of animal protein intake, and this number would be larger if the poor could afford to buy more. Often referred to as “rich food for poor people,” fish provides essential nourishment, especially quality proteins and fats (macronutrients), vitamins and minerals (micronutrients). Second, for those involved in fisheries, aquaculture and fish trade, fish is a source of income which can be used to purchase other additional food items. Though this brief emphasizes the former, fish contributes to food security as an important protein accompanied to rice based diets in Asia, maize and cassava-based diets in Africa, though the consumption there is decreasing. Fish supply in Africa has been declining for a number of reasons while the demand has increased due to the rise in population, decrease in livestock production due to desertification, disease [Olaoye et al. 2007Olaoye, O.J., Ashley-Dejo, S.S., Fakoya, E.O., Ikeweinwe, N.B., Alegbeleye, W.O., Olukosi, J.O., lsitor, S.U. (2007). Introduction to Agricultural Marketing and Prices Principles and applications, Living Book Series Abuja.. Google Scholar], and drought. Strategies to increase fish supply are being promoted globally.
According to Idowu et al. [2012]Idowu, A.A., Olaoye, O.J., Ifebesan, A., Abdul, W.O., Oluwale, O.B. (2012). Evaluation of fishermen and fish traders in transactional sex for fish marketing in coastal areas of Ogun Waterside Local Government Areas of Ogun State, Nigeria. Global J. Sci. Front. Res., Agric. Biol., 12(1), 43–54. Google Scholar fish abundance is only experienced in the rainy season; however, their consumption is year-round. Time utility is created in the process of making fish available to consumers all the year. Time utility is created through processing and storage activities. Through marketing activities, fish may be stored and processed by drying, smoking or boiling. This helps to preserve the fish and make it fit for consumption throughout the year.
Marketing of food in Nigeria is generally characterized by multitudes of deficiencies and problems. Fish marketing is no different. These problems cut across processing, preservation, packaging, distribution and transportation. In fish marketing, problems of shortage of supply, price fluctuations due to drying up of sources of water, and spoilage on transit, have been identified in the country [Ali et al. 2008Ali, E.A., Gaya, H.I.M., Jampada, T.N. (2008). Economic analysis of fresh fish marketing in Maiduguri Gamboru Market and Kachallari Alau Dam landing site of North Eastern Nigeria. J. Agric. Sci., 4(1), 23–26. Google Scholar]. Also, inadequate processing skills produce deterioration and lack of storage facilities has been pointed out as the major constraints perceived by marketers. Much attention was given to physical fish production technology while a little interest was shown on the marketing aspect to complete the production cycle. It is obvious that increased production without corresponding increase in marketing activities may leads to wastage of resources [Awonyinka 2009Awonyinka, Y.A. (2009). Cassava marketing: Option for sustainable agricultural development in Nigeria. Ozean J.f Appl. Sci., 2(2), 175–183. Google Scholar].
The importance of the fishery subsector cannot be overemphasized. Fish, many times has been described as rich food for poor people. It provides excellent high-quality proteins and has a concentration of calcium and phosphorus in the bones [USAID 2010USAID (2010). Best Management Practices for Fish Farming Package of Practices (POP) for Fish Farming. USAID Markets Programme, Nigeria. Google Scholar]. Fish oil lowers blood pressure and fin fish has been shown to reduce the risk of blood cancer and reduces insulin resistance in skeletal muscle. According to Adebayo and Anyanwu [2013]Adebayo, E.F., Anyanwu, S.O. (2013). Trends in Aquaculture Production in Nigeria: Implication for Food Security. Paper Presented in the 5th PAFFA conference, University of Burundi, Burundi. Google Scholar, 'fish supplies as much as 80% of animal protein in coastal areas', it supplies micronutrients such as irons, iodine, calcium, vitamin A, and Vitamin B in the diets of people in these areas. Fish is also available in different forms as fresh, dried, smoked, canned, frozen, etc. Fish consumption cuts across religion for it is free from any religious taboo. Fish is the best food for human consumption according to USAID [2010]USAID (2010). Best Management Practices for Fish Farming Package of Practices (POP) for Fish Farming. USAID Markets Programme, Nigeria. Google Scholar as it is low in fat, calories, and cholesterol.
In view of the above, the study seeks to comparatively address the following questions:
The objectives are to comparatively:
According to Panda [2011]Panda, S.C. (2011). Farm Management and Agricultural Marketing. Kalyani Publishers, New Delhi, India, 263–300. Google Scholar, marketing is “the performance of all business activities involved in the flow of goods and services from the point of production until they are in the hands of the ultimate consumer”. Agricultural marketing in Nigeria is such important aspect of the country’s agriculture that the agriculture sector is backward partly due to poor marketing linkages and the absence of a specialized transport and logistics system for the wares produced at farm gate. Adesanya [2000]Adesanya, A. (2000). Transportation Development in Nigeria in 2010 Ibadan: Nigerian Institute of Social and Economic Research (NISER).. Google Scholar stipulated that rural transportation in Nigeria is characterized by a number of difficulties and deplorable conditions of road and vehicles. This is still while facing low productivity and rural poverty.
Generally, an efficient marketing system is one in which there is greater share of producers’ sharing the consumers purchasing power and also where the marketing cost has been so decreased that it leads to the producers’ and consumers’ surplus [Kumar et al. 2019Kumar, R.S., Kumar, D.K., Hoilenting, Prakash, S. (2019). Structure, conduct and performance of fish markets of Khagaria District, India. Int. J. Res. Busin., Econ. Manag., 3(4), 1–13. Google Scholar]. Market performance is a broad term detailing the economic results that flow from the industry as each fir, pursues its particular line of conduct. Market performance encompasses gross margin, marketing margin and marketing efficiency as it relates to individual market actors such as producers, wholesalers and retailers [Acharya 2004Acharya, S.S. (2004). Agricultural Marketing in India, 4/E. Oxford & IBH Publishing Company Pvt. Limited. Google Scholar]. Fish marketing is especially difficult given that the fish are fragile and require extra care and attention to transport. A growing body of works (including Bukenya et al. [2012]Bukenya, J.O., Hyuha, T., Twinamasiko, J., Molnar, J. (2012). Economics of fish marketing in Central Uganda: a preliminary analysis. Selected Paper prepared for presentation at the Southern Agricultural Economics Association Annual Meeting, Birmingham, AL, February 4–7. Google Scholar, Nsikan et al. [2015]Nsikan, E.B., Okon, E.U., Umoh, I.U., Nyong, E.E. (2015). Analysis of the determinants of fresh fish marketing and profitability among captured fish traders in South Nigeria: The case of AkwaIbom State. Brit. J. Econ., Manag. Trade, 5(1), 35–45. https://doi.org/10.9734/BJEMT/2015/10744, Adedeji et al. [2019]Adedeji, T., Osundare, F., Ajiboye, A. (2019). Profitability and marketing efficiency of smoked fish: an empirical evidence from Ondo State, Nigeria. Int. J. Agric. Ext. Rural Dev. Studies, 6(3), 26–33. Google Scholar) have indicated some of the constraints to fish marketing in Nigeria to include low prices, absence of linkages between the areas of mass production to the areas of high demand, poor capital, dearth in storage facilities, transportation constraints, immaturity of fish and poor size of fish and high taxes and levies.
Bassey et al. [2013]Bassey, N.E., Okon, U.E., Ibok, O.W., Umoh, I.U. (2013). Comparative analysis of the economics of aquacultural fish production in some parts of South Nigeria. J. Agric. Biol. Sci., 8(8), 587–595. Google Scholar stipulated that fish marketing is a very delicate business requiring skills and manoeuvres to avoid losses. Dry fish marketing is particularly critical in the sense of the extra storage constraint and the level of inadequacy of the storage technology and/or facilities as well as poor timing in storage [Kallon et al. 2017Kallon, A., Lebbie, A., Sturm, B., Garnett, T., Wadsworth, R. (2017). Comparative studies of fish smoking and solar drying in the Sierra Leone artisanal fishing industry. J. Stored Prod. Postharvest Res., 8(3), 40–48. Google Scholar]. Dry fish is a low-cost source of vital food protein. The growing relevance of dry fish is indubitable but aspects of traditional dry fish production methods have been identified to be problematic [Payra et al. 2016Payra, P., Maity, R., Maity, S., Mandal, B. (2016). Production and marketing of dry fish through the traditional practices in West Bengal coast: Problems and prospects. Int. J. Fish. Aquat., 4(6), 118–123. Google Scholar]. Although Agbebi [2010]Agbebi, F.O. (2010). Salient issues in fish marketing system in Nigeria. J. Envir. Issues Agric. Dev. Count., 2(1), 94–105 Google Scholar has described fish marketing as a primordial activity, new challenges of fish marketing and the question of profitability have recently arisen. There is empirical evidence as to the profitability of fish marketing in different parts of the country [Bukenya et al. 2012Bukenya, J.O., Hyuha, T., Twinamasiko, J., Molnar, J. (2012). Economics of fish marketing in Central Uganda: a preliminary analysis. Selected Paper prepared for presentation at the Southern Agricultural Economics Association Annual Meeting, Birmingham, AL, February 4–7. Google Scholar, Onyemauwa 2012Onyemauwa, C.S. (2012). Analysis of fresh and dried fish marketing in Southeast Nigeria. J. Biol., Agric. Health., 2(4), 74–84. Google Scholar, Osundare and Adedeji 2018Osundare, F., Adedeji, T. (2018). Economic analysis of market performance of fresh fish in Lagos State, Nigeria. Int. J. Environ., Agric. Biotech., 3(2), 595–599. https://doi.org/10.22161/ijeab/3.2.38]. Irhivben et al. [2015]Irhivben, B.O., Enyioko, O., Oluwafemi, Z., Yusuf, S.A. (2015). Structure and performance of Catfish Market in Ibadan Metropolis, Oyo State, Nigeria, Int. J. Social Sci. Human. Res., 3(3), 428–433. Google Scholar have posited that marketing fish in Nigeria is influence by mechanisms of seasonality, bargain power of consumers as well as the effect of demand and supply. Nonetheless, sustainability of fish production will be determined by the structure and performance in balancing demand with supply.
The study was conducted in Toto Local Government Area (LGA) of Nasarawa State, Nigeria. The study area is located in the Western Agricultural Zone of the State (Fig. 1). The LGA is located on latitudes 7°, 25$^′$ N and longitude 8°, 20$^′$ E is located on latitudes 5°–14° N and longitudes 5°–18° E. It is bordered to Kuje Area Council of Federal Capital Territory to the North: Koton-Karfe LGA of Kogi State to the South, while to the West, Abaji Area Council of the F.C.T and Nasarawa LGA of Nasarawa State to the East. It has annual average rain fall of between 1100 and 2000 mm (Bureau of Land Survey Lafia 2005Bureau of Land Survey Lafia (2005). Annual Rainfall Data.. Google Scholar). Rainfall varies from 131.73 cm in some place to 145 cm in other, maximum temperature of 35℃ and minimum temperature of 10℃. It has an area of 2,903 km and had a population of 119,077 as at 2006 [NPC 2006NPC (2006). Nigeria National Population Census. National Population Council. Google Scholar]. At 2.8% growth rate as provided for by NPC [2006]NPC (2006). Nigeria National Population Census. National Population Council. Google Scholar the population is projected to be 160,700 in 2017. The dominant occupation of the inhabitants is agriculture; crops grown include maize, cassava, yam, sorghum, millet, rice, cowpea, sesame, cocoyam, sweet potato among others. Livestock rearing is also practiced.
|
Fig. 1. Map of Nasarawa State showing the study area, Toto LGA |
A two-stage sampling technique involving purposive and random sampling was adopted for the selection of eighty (80) fish traders for the study. The first stage was the purposive selection of four markets out of the seven (7) markets (Agyeneze, Dausu, Katakpa, Shege, Toto, Ugya and Umaisha) in the area on the basis of the magnitude of sales recorded by these markets. These are markets where smoked and fresh fish were predominantly traded. These four markets are: Dausu, Toto, Shege and Umaisha. The second stage was random selection of twenty fish marketers per market (ten each of smoked and fresh fish marketers per market) after a pre-survey carried out to obtain the list of fish traders in each market to serve as a sampling frame. Data for the study were finally obtained using primary sources through structured questionnaires which were administered to the selected fish sellers.
The following tools were employed and used in the study. Descriptive statistics was used to measure frequencies, percentages, ranking (objectives 1, 4 and 5), Gini Coefficient (G.C) (objective 2). Farm budgetary technique: Gross margin analysis was employed to ascertain the profitability of both smoked and fish marketing, (objective 3) of the study.
The G.C was use together with Lorenz curve to measure the level of m marketer’s concentration. This will help in determining the degree of competition or monopoly in the fish market.
The Gini coefficient (GC) is presented as follows:
$$\text{GC}=1-\sum{XY}$$
where:
\( \sum \) – summation sign
\( X \) – proportion of fresh/dried fish sellers
\( Y \) – cumulative percentage of the sales
The G.C has the possibly of values ranging between 0 and 1 expressing the extent to which the market is concentrated. A perfect equality in concentration (low) of sellers is expected if the value of the gini coefficient tends towards zero, while perfect inequality in concentration (high) of sellers is expected if the GC value tends towards one. On the other hand, if GC = 1, the market is said to be imperfect, and if GC = 0, the market is perfect and competitive.
Marketing margin, costs and returns and marketing efficiency were used to examine market performance in fresh and dried fish marketing in the study area. Marketing efficiency is defined as the maximization of the ratio of output to input in marketing [Olukosi et al. 2005Olukosi, J.O., Isitor, S.U., Ode, M.O. (2005). Introduction to agricultural marketing and prices. Principles and Applications. G. U. Publication Abuja, Nigeria. Google Scholar]. Marketing efficiency is the ratio of market output to market input and is the degree of marketing performance. Increasing ratio represents improved efficiency and decrease denotes reduced efficiency [Acharya and Agarwal 2004Acharya, S.S., Agarwal, N.L. (2004). Agricultural marketing in India, 4th edn. Oxford and IBH Publishing, New Delhi. Google Scholar].
$$ \text{Marketing efficiency} = \frac{\text{Gross revenue (GR)}}{\text{Total marketing cost (TMC)}} \times 100 $$
According to Olukosi and Erhabor [1988]Olukosi, J.O., Erhabor, P.O. (1988). Introduction to farm management economics: principles and application. AGITAB Publishers Limited. Zaria, 9. Google Scholar, Gross margin is used as a tool for planning where fixed costs is a negligible portion of the enterprise.
$$ \text{Gross margin}=\text{TR (P*Q)} - \text{TVC} $$
$$ \text{Percentage marketing margin}= \frac{\text{Margin of sales}}{\text{Selling price}} \times 100 $$
$$ \text{Net benefit cost ratio}=\frac{\text{Net revenue}}{\text{Total cost}} $$
$$ \text{Benefit cost ratio}=\frac{\text{Total revenue}}{\text{Total cost}} $$
The socio-economic characteristics of respondents such as age, gender, marital status, educational level, household size, sources of capital, years of marketing experience, membership of marketer association were analysed using simple descriptive statistics as presented in Table 1. The results showed that majority of the marketers were female (58.7%) while 41.3% of the respondents were male. This implies that fish market consists of both male and female and there is no bias based on sex in fish marketing. This finding is similar to that of Offor et al. [2016]Offor, E.I., Ibeagwa, O.B., Ikemefuna, C.S. (2016). Performance of fresh fish marketing in Port Harcourt Municipal, Rivers State, Nigeria. Niger. J. Agric., 12, 133–136. Google Scholar who stated that female’s role was more in the marketing of smoked fish than the males. This is also in consonance with the findings of Thilsted et al. [2015]Thilsted, S.H., James, D., Jopper, J., Subas, R., Nghe, E., Karunsagar, M. (2015). Nutrition better lives; Maximizing the contribution of fish to human nutrition. FAO 2nd International Conference, Rome, 65–76. Google Scholar who reported that women are actively involved in fish marketing and processing. Result also reveals that 40.0% of the respondents were within the age group of 15–25 years, 32.5% were within the age group of 45 and above, 20.0% were within the age group of 26–34 years and 7.5% were within the age group of 35–44 years. The mean age was approximately 33 years. This implies that the marketers were in their active age and will be able to carry out their marketing activities efficiently. Marital status, results further shows that 73.7% of the respondents were married and this implies that they had more responsibilities to manage. Marriage is generally regarded as an important factor in the livelihood and social wellbeing of an individual in our society as it is perceived to confer responsibility to an individuals. This finding is consonances with that of Eze et al. [2010]Eze, S.O., Ezeh, A.N., Onwubuya, E.A (2010). Women marketers' perceived constraints on elected agricultural produce marketing in Enugu South Local Government Area: challenges of extension training for women groups in Enugu State, Nigeria. Agro-Sci. J. Trop. Agric., Food, Env. Exten, 9(3), 215–222. https://doi.org/10.4314/as.v9i3.65762 who reported that in Enugu State, married women constituted the majority of agricultural produce marketer.
Results in Table 1 also show that most (58.7%) of the respondents had household size that ranged between 1 and 5 persons. The mean household size was 6 individuals. Greater household sizes provide free labour but subject to the willingness to support the family in its fish marketing. This result is in consonances with Nwalieji et al. [2014]Nwalieji, H.U., Madukwe, M.C., Agwu, A.E., Umerah, M.I. (2014). Adoption of rice technologies introduced by the United State Agency for international development in Anambra and Ebonyi States, Nigeria. J. Agric. Ext., 18(1), 143–154. https://doi.org/10.4314/jae.v18i1.13 opined that large household size ensures availability of labour for marketing activities. This finding also supports the result of Anozie et al. [2014]Anozie, R.O., Anozie, S.N., Usanga, U.J., Okelola, O.E. (2014). The state of adoption of yam mini sett technique in Imo State, Nigeria. Asian Journal of Agricultural Extension, Appl. Res. Technol., 2, 38–43. Google Scholar who reported that large household size compliment labour to enhance production and productivity thereby leading to increase in income. Educational level: It is an important factor which can influence fish marketing and determine the level of awareness. It can be seen that 35% of the respondents had no formal education, 27.5% had secondary education, 20.0% of the respondent had tertiary education and while 17.5% had primary education. This implies that majority of fish marketers in the area were educated and they could read and write. Literacy level is strongly correlated to adoption attitude, Dogondaji and Baba [2010]Dogondaji, S.D., Baba, K.M. (2010). Income distribution in large scale irrigation projects: A case study of dry season rice farmers at the Bakolori irrigation project, Zamfara state, Nigeria. Proceedings of the 24th Annual National Conference of the Farm Management of Nigeria held at the Adamawa State University, Mubi, 11th–14th October, 2010. Google Scholar observed that high literacy level could have positive impact on the adoption of technologies.
On the size of membership of cooperative, results revealed that 63.7% of the respondents do not belong to any marketing association. This high percentage might possibly due to low cohesion of the fish farmers as well as absence of cooperative groups in their environment. It could be attributed to lack of knowledge about the importance of belonging to a group as well as inadequate mobilization and sensitization by change agents or their complete absence in the study areas. According to Waziri et al. [2014]Waziri, A., Tsado, E.K., Likita, T., Gana, A.S. (2014). Socio-economic factors influencing adoption of maize seed Technology in Niger State of Nigeria. J. Biol., Agric. Health., 4(5), 98–105. Google Scholar marketers belonging to a cooperative association will likely be protected from exploitation, hence encouraging efficient marketing system. Cumulatively, 36.3% of the two categories of fish marketers had been in the trade for a period of between 5 and 10 years while 23.7 of the respondents have been marketing for 11 to 16. About 15% of the respondents were in fish business for 17–22 years while 25% had marketed fish for 23 and above. The mean marketing experience was estimated at 15 years. This indicates that the marketers were experienced in their business and should therefore be able to carry out fish marketing through adhering to some precautions thereby helping in maximizing profit. This is in agreement with the findings of Ali et al. [2008]Ali, E.A., Gaya, H.I.M., Jampada, T.N. (2008). Economic analysis of fresh fish marketing in Maiduguri Gamboru Market and Kachallari Alau Dam landing site of North Eastern Nigeria. J. Agric. Sci., 4(1), 23–26. Google Scholar who reported that fresh fish marketers in their study had adequate marketing experience.
Table 1. Distribution of respondents according to socioeconomic characteristics |
|||||||
Variable |
Frequency |
Percentage |
Combined frequency |
Mean of combined percentage |
General Mean |
||
Smoked fish market |
Fresh fish market |
Smoked fish market |
Fresh fish market |
||||
Age |
|
|
|
|
|
|
|
15–24 |
16 |
10 |
40 |
25 |
26 |
32.5 |
|
25–34 |
8 |
12 |
20 |
30 |
20 |
25 |
33 years |
35–44 |
3 |
14 |
7.5 |
35 |
17 |
21.3 |
|
45 and above |
13 |
4 |
32.5 |
10 |
17 |
21.3 |
|
Total |
40 |
40 |
100 |
100 |
80 |
100 |
|
Gender |
|
|
|
|
|
|
|
Male |
– |
33 |
– |
82.5 |
33 |
41.3 |
|
Female |
40 |
7 |
100 |
17.5 |
47 |
58.7 |
|
Total |
40 |
40 |
100 |
100 |
80 |
100 |
|
Marital status |
|
|
|
|
|
|
|
Single |
10 |
8 |
25 |
20 |
18 |
22.5 |
|
Married |
27 |
32 |
67.5 |
80 |
59 |
73.8 |
|
Widowed |
3 |
– |
7.5 |
– |
3 |
3.8 |
|
Total |
40 |
40 |
100 |
100 |
80 |
100 |
|
Household Size |
|
|
|
|
|
|
|
1–5 |
21 |
26 |
52.5 |
65.0 |
47 |
58.7 |
|
6–10 |
15 |
14 |
37.5 |
35.0 |
29 |
36.3 |
6 persons |
11–15 |
4 |
– |
10 |
– |
4 |
5 |
|
Total |
40 |
40 |
100 |
100 |
80 |
100 |
|
Educational level |
|
|
|
|
|
|
|
Non formal education |
22 |
6 |
55 |
15 |
28 |
35 |
|
Primary |
4 |
10 |
10 |
25 |
14 |
17.5 |
|
Secondary |
12 |
10 |
30 |
25 |
22 |
27.5 |
|
4.00 |
2 |
14 |
5 |
35 |
16 |
20 |
|
Total |
40 |
40 |
100 |
100 |
80 |
100 |
|
Membership of Association |
|
|
|
|
|
|
|
No |
14 |
15 |
35 |
37.5 |
51 |
63.7 |
|
Yes |
26 |
25 |
65 |
62.5 |
29 |
36.3 |
|
Total |
40 |
40 |
100 |
100 |
80 |
100 |
|
Marketing Experience |
|
|
|
|
|
|
|
5–10 |
19 |
10 |
47.5 |
25 |
29 |
36.3 |
|
11–16 |
9 |
10 |
22.5 |
25 |
19 |
23.7 |
15 years |
17–22 |
5 |
7 |
12.5 |
12.5 |
12 |
15 |
|
23 and above |
7 |
13 |
17.5 |
17.5 |
20 |
25 |
|
Total |
40 |
40 |
100 |
100 |
80 |
100 |
|
Source: Field survey, 2019 |
|||||||
The Gini-coefficient (G.C) which is an instrument used in the analysis of the level of market structure for both smoked and fresh fish the study area are presented in Table 2 and Table 3. The estimated value of G.C for dried fish was 0.4801 which means that a randomly selected smoked fish marketer is expected to have a scale level which is 48% above or below the mean sales level. The value of the G.C is positive and about half, thus exhibits oligopolistic tendencies and therefore there is equality in the share of the market. Similarly, the computed G.C for fresh fish was estimated at 0.5857. This is approximately 0.6 (60%) and its closeness to one it shows that the concentration of the market is marginally high indicating the existence of inefficiency in the market structure so also non-competitive behaviour such as significant differences in market share and this further implies that fresh fish marketing in the area was dominated by few marketers. It can be deduced that it was an imperfect market and that, there was a high degree of inequality and high level of concentration within the markets. The result further revealed that access to information was limited as marketers had inadequate information regarding the pricing. Similarly, price discrimination prevailed in the market as fish was sold it different prices to different actors in various parts of the selected fish markets due largely to inadequate information prevailing in the market by consumers, despite the fact that the markets are un-organized and there exist free entry and in the market. Lack of adequate information about the activities in the market is one of the characteristics of a monopoly. This finding is similar to the results obtained by Eronmwon et al. [2014]Eronmwon, I., Alufohai, G.O., Ada-Okungbowa, C.I (2014). Structure, conduct and performance of plantain marketing in Edo State, Nigeria. J. Appl. Sci. Environ. Manage, 18(3), 437–440. Google Scholar.
Table 2. Market structure for smoked fish (result of Gini-coefficient analysis) |
|||||||
Income earn/month |
Number of sellers (N) |
Proportion of sellers (X) |
Cumulative Proportion of sellers |
Total sales/day |
Proportion of sales |
Cumulative Proportion of sales (Y) |
∑XY |
5000 |
6 |
0.15 |
0.15 |
6000 |
0.10 |
0.10 |
0.015 |
6000 |
3 |
0.08 |
0.23 |
8000 |
0.08 |
0.18 |
0.014 |
7000 |
6 |
0.15 |
0.38 |
10000 |
0.15 |
0.33 |
0.050 |
8000 |
4 |
0.10 |
0.48 |
12000 |
0.15 |
0.48 |
0.048 |
9000 |
2 |
0.05 |
0.53 |
14000 |
0.08 |
0.56 |
0.028 |
10000 |
6 |
0.15 |
0.68 |
15000 |
0.08 |
0.64 |
0.096 |
11000 |
2 |
0.05 |
0.73 |
18000 |
0.02 |
0.66 |
0.033 |
12000 |
3 |
0.08 |
0.81 |
22000 |
0.15 |
0.81 |
0.065 |
14000 |
3 |
0.07 |
0.88 |
25000 |
0.05 |
0.86 |
0.060 |
15000 |
4 |
0.10 |
0.98 |
30000 |
0.05 |
0.91 |
0.091 |
20000 |
1 |
0.02 |
1 |
40000 |
0.10 |
1 |
0.020 |
Total |
40 |
1 |
|
|
1 |
|
0.520 |
Source: Field survey, 2019 |
|
||||||
Table 3. Market structure for fresh fish (result of Gini–coefficient analysis) |
|||||||
Income earn/month |
Number of sellers (N) |
Proportion of sellers (X) |
Cumulative Proportion of sellers |
Total sales/day |
Proportion of sales |
Cumulative Proportion of sales (Y) |
∑XY |
5000 |
5 |
0.13 |
0.13 |
5000 |
0.08 |
0.08 |
0.010 |
7000 |
4 |
0.10 |
0.23 |
6000 |
0.08 |
0.16 |
0.016 |
9000 |
7 |
0.18 |
0.41 |
7000 |
0.05 |
0.21 |
0.038 |
10000 |
5 |
0.12 |
0.53 |
8000 |
0.10 |
0.31 |
0.037 |
15000 |
4 |
0.10 |
0.63 |
9000 |
0.08 |
0.39 |
0.039 |
18000 |
1 |
0.02 |
0.65 |
10000 |
0.20 |
0.59 |
0.012 |
20000 |
5 |
0.13 |
0.78 |
12000 |
0.08 |
0.67 |
0.087 |
22000 |
2 |
0.05 |
0.83 |
13000 |
0.02 |
0.69 |
0.035 |
24000 |
2 |
0.05 |
0.88 |
14000 |
0.02 |
0.71 |
0.036 |
26000 |
2 |
0.05 |
0.93 |
15000 |
0.07 |
0.78 |
0.039 |
28000 |
1 |
0.02 |
0.95 |
18000 |
0.02 |
0.8 |
0.016 |
30000 |
2 |
0.05 |
1 |
20000 |
0.2 |
1 |
0.05 |
Source: Field survey, 2019 |
|
||||||
The measurement of the cost and returns of smoked and fresh fish marketing in the study area was carried out with the use of budgetary techniques as presented in Table 4 and Table 5 respectively. Extrapolation of the quantity of fresh fish sold by respondents was 39,920 kg thereby generating a total revenue (TR) of ₦7,185,600.00 and this further translates to an average fresh fish sold at 998 kg at a price of ₦180 per kg. The calculated average revenue was ₦179,640.00 per month. On the other hand, the total quantity of smoked fish sold was estimated at 60,808 kg and sold at a price of ₦250 per kg. The average smoked fish sold was 1520.2 kg at a price of ₦250 per kg. This translates to about ₦15,202,000. Therefore, this indicated that on the average, a marketer received a revenue of ₦380,050 per month.
Table 4 shows the result of annual cost and returns from fresh fish marketing. The mean gross revenue was determined at ₦179,640.00 per marketer while the total variable cost was computed at ₦5,709,618 per month at an average total variable cost of ₦148,840.45 per month. The result on the table also shows that benefit cost ratio for fresh fish marketing was ₦0.26. This implies that ₦0.26 was made for every ₦1 invested in the fresh fish business. The marketing efficiency for fresh fish marketing was calculated at 2.93 (293%) while that of smoked fish marketers was estimated at 8.60 (860%) implying efficient marketing of both fresh and smoked fish in the study area although smoked fish marketing was more efficient. The results in both Table 4 and Table 5 show that fish marketing activities among fish marketers were efficient since the calculated efficiency values were higher than 100 percent (293% for fresh fish and 860% for smoked fish). These values indicated that any increase in the cost of carrying out marketing activities by 100% will yield more than proportionate increase of 193 percent and 760 percent for fresh and smoked fish respectively and this further explains the higher level of satisfaction generated from a unit of fresh and smoked fish sold in the sampled markets.
On the other hand, smoked fish marketing proved to be more lucrative (Table 4). The Av. Total Revenue from smoked fish sales was ₦380,050. The average net return was ₦232,473.5. The net benefit cost ratio was calculated at ₦1.57. This implies that ₦0.57 was made on every ₦1 invested into the smoked fish enterprise. The profitability ratios (FR, OR and GR) were computed and all were positive with values of less than one (0.039, 0.35 and 0.39) indicating further that smoked fish business profitable and worth participating and promoting in the study area.
Table 4. Cost and returns of fresh fish marketing per month |
||
Items |
Mean value (N)* |
Percentage of VC |
A. Returns |
|
|
Total Revenue (TR) from fresh fish sales |
7,185,600.00 |
|
Average TR |
179,640.00 |
|
Cost of fish |
3,255,618 (81,390.45) |
57.02 |
Transport cost |
1,380,000 (34,500) |
24.27 |
Storage cost |
560,000 (14,000) |
9.81 |
Packaging cost |
48,000 (1,200) |
0.84 |
Cost of labour |
180,000 (4,500) |
3.15 |
Union charge |
26,000 (650) |
0.46 |
Feeding |
260,000 (6,500) |
4.55 |
Total variable cost (TVC) |
5,709,618 |
|
Average TVC |
142,740.45 |
|
Gross margin (GM) = TR – TVC |
1,475,982 |
|
Average GM |
36,899.55 |
|
Benefit cost ratio = Av. GM/Av. TVC |
0.26 |
|
2.93 |
|
|
Marketing efficiency percentage (ME%) |
293% |
|
Source: Field survey, 2019 |
*Figures in parenthesis represent individual means |
|
Averages were used for the variable computation. From the calculated average total variable cost for fresh fish which was ₦142,740.45; cost of fish (₦81,390.45) accounted for 57.02% of the average total variable cost and raked first, while costs of; transportation (₦34,500), storage (₦14,000) and feeding (₦6,500) accounted for 24.27%, 9.81% and 4.55% and they ranked second, third and fourth respectively. Similarly, the computed average total cost for smoked fish is ₦148,026.50; comprising of average total variable cost of ₦133,126.50 and average total fixed cost of ₦14,900. The estimated percentage of the of the variable cost is 89.33 while fixed cost represented 10.67%.Out of the average total variable cost (smoked fish), cost of fish (₦88,976.5) accounted for 66.84% and ranked first, followed by transport (₦23,400) representing 17.58% ranking second, while feeding (₦6,800) representing 5.11% and ranked third, with cost of storage (₦5,000) accounted for 3.76% and ranked 4th.
Table 5. Cost, returns and net returns of smoked fish per month |
||
Items |
Mean value |
Percentage of VC |
A. Returns |
|
|
Total Revenue (TR) from dried fish sales |
15,220,000 |
|
B (i): variable costs |
|
|
Cost of fish |
3,559,060 (88,976.5) |
66.84 |
Transport cost |
936,000 (23,400) |
17.58 |
Storage cost |
200,000 (5,000) |
3.76 |
Packaging cost |
80,000 (2,000) |
1.5 |
Cost of labour |
72,000 (1,800) |
1.35 |
Union charge |
26,000 (650) |
0.49 |
Feeding |
272,000 (6,800) |
5.11 |
Fuel
|
180,000 (4,500) |
3.37 |
Av. TVC |
133,126.50 |
|
B (ii): Fixed cost |
|
|
Depreciation of oven |
88,000 |
|
Depreciation of generator |
60,000 |
|
Depreciation of other equipment (tables, basins, nets) |
48,000 |
|
Rent |
400,000 |
|
Total Fixed cost (TFC)
|
596,000 |
|
Total cost (TC) = TVC + TFC |
5,921,060 |
|
Net returns (NR)= (TR–TC) |
9,298,940 |
|
Benefit cost ratio |
2.57 |
|
Net benefit cost ratio (NBCR) = (NR/TC) |
1.57 |
|
Marketing efficiency (ME) = TR/TMC |
8.6 |
|
Source: Field survey, 2019 |
* Figures in parenthesis represent individual means |
|
The analysis as revealed in tables 3a and 3b indicated that there existed significant revenue differential between smoked fish (₦380,500.00) and fresh fish (₦179,640.00) of ₦200,860.00. This accounted for about 111.82% indicating that smoked fish marketing yields higher revenue than fresh fish, in the study area, possibly due to value addition arising from processing the fish into smoked fish.
The result further showed that the level of revenue per marketer (₦380,500.0) realised from smoked fish marketing is higher than the revenue (₦179,640.00) obtained from fresh fish, so also the value of the variable costs (66.84%) than the computed value for fresh fish (57.02%).
Generally, marketing channels refers to the sequence through which the fish passes from the fishers to the consumers or the marketing intermediaries. The analysis of the marketing channels is intended to provide an inside knowledge of the flow of goods and services from their primary source (origin/producers) to the final destination (consumers). During the study, the following major dried and fresh fish marketing channels were identified and a total of 1,520.2 kg of smoked and 998 kg of fresh fish were transacted. The study revealed a decentralized approach for the disposal of their fish. A decentralized channel is usually a short chain which reduces the activities of middlemen thereby, minimizing the level of exploitation of buyers in the marketing channel. This is in consonance with Madugu and Edward [2011]Madugu, A.J., Edward, A (2011). Marketing and distribution channels of processed fish in Adamawa State, Nigeria. Global J. Manag. Busin. Res., 11(4), 21–26. Google Scholar who reported that there was a decentralized marketing channel for processed fish in Adamawa State, Nigeria as both consumers and middlemen bought their supplies directly from the producers.
The various marketing channels for both smoked and fresh fish are presented in Fig. 2 and Fig. 3, which were identified based on the channels used in trading their fish. The result revealed that the smoked fish marketers sold their fish through the following channels.
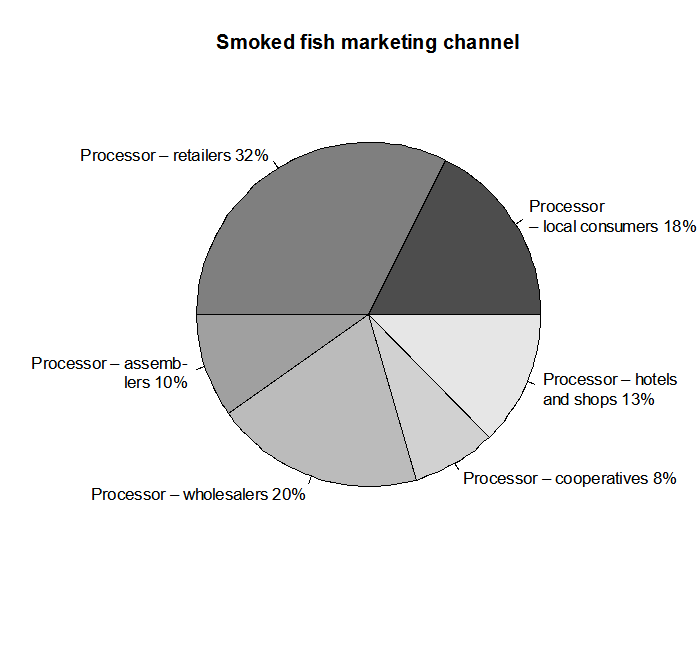
Table 6 show the channels through which smoked fish is marketed in the area. From the table, most (32.5%) of the processors sell directly to retailers, some 17.5% sell to local consumers and 12.5% sell to hotels and shops. About 20% of the processors sold to wholesalers, 10% to assemblers and 7.5% sold to cooperatives. From the analysis of the marketing channels, it can be inferred that there is no direct channel for marketing in a linear manner. Processors sell to any actor in the value chain regardless of which position they occupy in the chain. This could be attributed to the lack of strong union to enforce mandatory sales through strategic marketing channels. This finding is congruent to the findings of Mebrate and Worku [2019]Mebrate, Y., Worku, A. (2019). Structure, conduct and performance of fish market in Central Ethiopia. Management Studies and Economic Systems (MSES), 4(4), 295–303. Google Scholar who asserted that most of the profit and fish commodity went directly to the retailers.
|
Fig. 2. Chart showing smoked fish marketing channel |
|
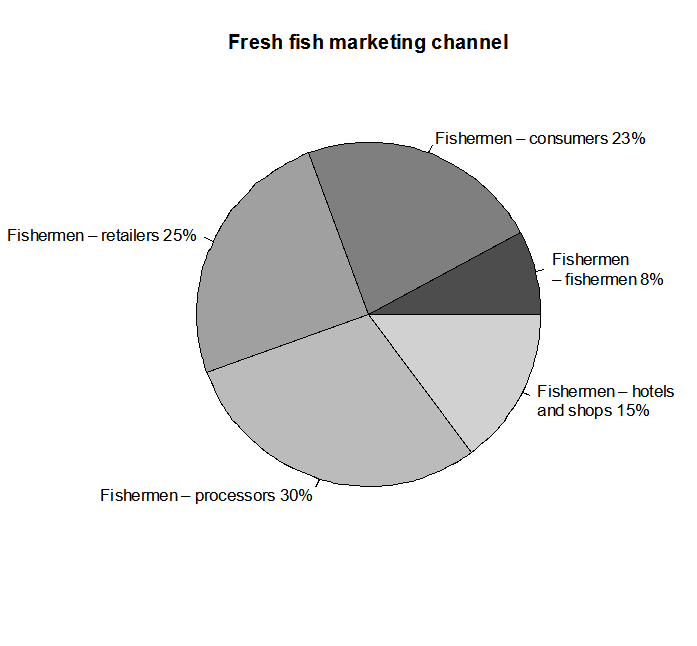
Fig. 3. Chart showing fresh fish marketing channel |
The marketing channels of fresh fish is given on Table 7. The result therein reveals that the channel of marketing fresh fish is distinct from that of dried fish marketing. The central marketing cost for dried fish was the processors while fishermen were the central source of marketing for fresh fish. Most (30%) of the fishermen sold to processors. This was followed by retailers (25%), consumers (22.5%) and sales to hotels/shops (15%). In special need cases fishermen sold to other fishermen. This is however not commonplace as it is assumed to be the least profitable. This channel was responsible for 7.5% of the total marketing volume. Rahman et al. [2012]Rahman, M.M., Hossain, M.A., Fatematuzzhura., Tasnoova, S., Ahamed, F., Hossain, M.Y., Ohtomi, J. (2012). Fresh fish marketing status in the Northwestern Bangladesh: Recommendations for sustainable management. Our Nature, 10, 128–136. https://doi.org/10.3126/on.v10i1.7773 also indicated a highly variable fresh fish marketing channel in Bangladesh.
Table 6. Distribution of respondents according to marketing channels for smoked fish |
||
Categories of respondent |
Frequency |
Percent |
Processors – local consumers |
07 |
17.5 |
Processors – retailers |
13 |
32.5 |
Processors – assemblers |
04 |
10 |
Processors – wholesalers |
08 |
20 |
Processors – cooperatives |
03 |
7.5 |
Processors – hotels/shops |
05 |
12.5 |
Total |
40 |
100 |
Source: Field survey, 2019 |
|
|
Table 7. Distribution of respondents according to marketing channels for fresh fish |
||
Categories of respondent |
Frequency |
Percent |
Fishermen – fishermen |
03 |
7.5 |
Fishermen – consumers |
09 |
22.5 |
Fishermen – retailers |
10 |
25 |
Fishermen – processors |
12 |
30 |
Fishermen – hotels/shops |
06 |
15 |
Total |
40 |
100 |
Constraints to fish marketing in the study area are presented in Table 8 and Table 9. The values were in multiple responses. Results revealed that among the identified constraints to fresh fish marketing seasonality was ranked first with about 95%, followed by low profit which accounted for 87.5%, while lack of credit facilities appeared as the third constraint with 82.5%. Lack of storage facilities was tied as third accounted for by 82.5% of the respondents. Similarly, cost of transportation, (77.5%), high cost of fish gears (70%) and lack of capital (67.5) also accounted for sizeable percentage of the constraints and ranked 6th. Similarly, lack of capital and government policy ranked 7th and each accounted for 62.5% This implies that these constraints affected fish production and marketing thereby limited the realization of higher level of profit arising from the enterprise. These findings are in consonance with the results obtained by Osarenren and Adams [2014]Osarenren, C.O., Adams, O.O. (2014). Marketing analysis of smoke-dried fish in Etsako East Local Government Area of Edo State, Nigeria.. Google Scholar who reported that among the problems confronting the marketing of smoke-dried fish in Etsako East Local Government Area of Edo State, Nigeria was lack of capital, high cost of storage facilities and price fluctuation.
Constraints to smoked fish marketing are presented in Table 9. From the result on the Table, extra cost incurred on fuel and fuelling materials was ranked first (97.5%). This is very important as the bulk of marketing cost is due to fuel or smoking materials. Smoked fish marketers identified seasonality as the 2nd most important constraint to their enterprise. Remoteness of market was identified by 87.5% of the respondents and was ranked third. This is because while fishing activities take place usually in rural areas, the major consumers live in urban and peri-urban centres. The fourth position was shared by inadequate capital and lack of preservative facilities with 85%. Fish spoilage was ranked 5th (77.5%), loss due to theft was ranked 6th (72.5%), deplorable conditions of rural roads was ranked 7th (70%), price instability was ranked 8th (67.5%) and high cost of transportation was ranked 9th (65%).
Table 8. Constraints to fresh fish marketing in the study area |
|||
Constraints |
*Frequency |
*Percentage |
Rank |
Seasonality |
38 |
95 |
1st |
Low profit from selling of fish |
35 |
87.5 |
2nd |
Lack of credit facilities |
33 |
82.5 |
3rd |
Lack of storage facilities |
33 |
82.5 |
3rd |
Cost of transportation |
31 |
77.5 |
4th |
High cost of processing materials |
28 |
70 |
5th |
Cost of fish gear |
27 |
67.5 |
6th |
Lack of capital |
25 |
62.5 |
7th |
Government policy |
25 |
62.5 |
7th |
Source: Field survey, 2019 |
*Multiple response |
||
Table 9. Constraints to smoked fish marketing in the study area |
|||
Constraint |
Frequency |
Percentage |
Rank |
Extra cost due to fuel/fuelling materials |
39 |
97.5 |
1st |
Seasonality |
37 |
92.5 |
2nd |
Remoteness of market |
35 |
87.5 |
3rd |
Inadequate capital |
34 |
85 |
4th |
Lack of preservative facilities |
34 |
85 |
4th |
Fish spoilage |
31 |
77.5 |
5th |
Loss due to theft |
29 |
72.5 |
6th |
Deplorable conditions of rural roads |
28 |
70 |
7th |
Price instability |
27 |
67.5 |
8th |
High cost of transportation |
26 |
65 |
9th |
Source: Field survey, 2019 |
*Multiple response |
||
From the findings in this research, it is concluded that fish marketing is a lucrative enterprise. However, smoked fish marketing was more lucrative (with a benefit cost ratio of ₦1.57/₦1 invested) than fresh fish marketing (with a cost benefit ratio of ₦0.26/₦1 invested). Both fresh and smoked fish marketing exhibited better marketing efficiency. Some of the major constraints identified by fresh fish marketers include; seasonality, low profit, lack of credit and storage facilities and poor transportation network. On the other hand, constraints experienced by dried fish marketers are; high cost of fuel/fuelling materials, seasonality, and remoteness of market, inadequate capital and lack of preservative facilities. Major marketing channels for smoked fish were; processors to retailers and processors to local consumers, while the major marketing channels for fresh fish as identified were; fishermen to processors, fishermen to retailers, and to consumers. The values of the Gini-Coefficients for smoked and fresh fish were calculated at 0.4801 and 0.5857. The general mean for both smoked and fresh fish marketers were; age (33 years), household size (6 persons), and marketing experience (15 years). It is recommended that the marketers organize themselves into cooperative organizations and set up strong market networks and linkages in order to benefit from available markets outside their immediate vicinities. Investment into preservative and storage technologies will improve the profitability and shelf life of fish resources. Transformation into electric kiln systems and use of rural refrigeration systems, such as those provided by Cold Hubs, are also a viable technology pathway to explore.
The study was financed from private funds of the Author.
Received: 15 Nov 2020
Accepted: 18 Jan 2021
Published online: 4 Jun 2021
Accesses: 1976
Girei, A.A., Ndanitsa, M.A., Ogezi, E., Imam, M.I., (2021). Smoked and fresh fish marketing in Toto Local Government Area of Nasarawa State, Nigeria: a comparative analysis. Acta Sci. Pol. Zootechnica, 20(1), 15–26. DOI: 10.21005/asp.2021.20.1.02.

 (Smoked
fish)
(Smoked
fish) (Fresh
fish)
(Fresh
fish)