
Research Article
Piotr Barski1, Magda Mielczarek ![]() 1,2, Magdalena Frąszczak
1,2, Magdalena Frąszczak ![]() 1, Joanna Szyda
1, Joanna Szyda ![]() 1,2
1,2
1Biostatistic Group, Department of Genetics, Wroclaw University of Environmental and Life Sciences, Wroclaw, Poland
2National Research Institute of Animal Production, Balice, Poland
Abstract. Copy number variants (CNV) provide a valuable data resource for genetic analysis, but their detection is imprecise and subjected to a high number of false positives. Therefore, main goals of this study comprised investigating of the biological impact of genome sequence complexity on CNV formation and assessing whether quality of the reference genome resulted in a false positive CNV deletion calls. The comparisons of probability distributions of complexity measures underlying deletion breakpoints with complexity measures of permuted sequences, representing complexity of a randomised sequence, revealed highly significant differences between true and permuted sequences. A significantly larger number of unknown nucleotides was observed when comparing distributions of the numbers of unknown nucleotides in sequences flanking CNV deletion breakpoints with sequences flanking CNV duplication breakpoints. CNVs appear to be preferentially initiated in regions of low sequence complexity.
Keywords: cattle, copy number variation, whole genome DNA sequence
A few years after the outburst of the sequencing boom in human genetics, the broad availability of individual whole genome sequences also became reality for livestock species. Among livestock, the cattle has been subjected to the highest number of whole genome sequencing projects, many of them cumulated within the frame of the 1,000 Bull Genomes Project [Daetwyler et al. 2014Daetwyler, H.D., Capitan, A., Pausch, H., van Binsbergen, R., Brøndum, R.F. et al. (2014). Whole-genome sequencing of 234 bulls facilitates mapping of monogenic and complex traits in cattle. Nat. Genet., 46, 858–865. https://doi.org/10.1038/ng.3034.], which currently (run 7) comprises whole genome sequences of over 2,700 cows and bulls representing Bos taurus and Bos indicus species. This and additional data resources available for cattle allowed for the identification of 97,126,084 single nucleotide polymorphisms (SNPs), short insertions and deletions (InDels), as well as 18,942 structural variants (Ensembl Variation data base rel. 95). On one hand these variants provide a valuable data resource for genetic analysis, but on the other hand a still relatively low coverage of genomes applied in sequencing studies in cattle is the cause of a high number of false positive and false negative variant detection. This problem applies especially to structural polymorphisms, represented by copy number variants (CNVs), large inversions and tandem duplications, since the bioinformatics behind their detection is not well standardized and prone to technical errors [Ye et al. 2016Ye, K., Hall, G., Nin, Z. (2016). Structural Variation Detection from Next Generation Sequencing. Next Generat. Sequenc. & Applic., S1, 007. https://doi.org/10.4172/2469-9853.s1-007.].
In this study, we investigated two aspects underlying detection of structural variants in the form of CNV deletions and duplications. The biological aspect considers the impact of nucleotide sequence complexity on the formation of structural variants. The underlying hypothesis is that CNVs are consequences of NAHR (non-allelic homologous recombination), which typically involves low copy repeat regions (LCR), i.e. regions which show high sequence identity [Conrad et al. 2010Conrad, D.F., Pinto, D., Redon, R., Feuk, L., Gokcumen, O. et al. (2010). Origins and functional impact of copy number variation in the human genome. Nature, 464(7289), 704–712. https://doi.org/10.1038/nature08516.]. The technical aspect considers the effect of reference genome quality, expressed by the number of unknown base pairs (N), on the detection of false-positive deletions. Here, the hypothesis is that stretches of Ns in the reference sequence results in a locally lower coverage during the alignment process and then, consequently, in false positive CNV deletion calls. Sequences 200 bp downstream and 200 bp upstream of the CNV breakpoints positions were analysed.
The data comprises the whole genome DNA sequence of 32 Polish Holstein-Friesian cows. A DNA Isolation System was used to isolate DNA form blood samples and the 2200 TapeStation DNA Screen Tape device was used to verify the quality of the DNA. Moreover, the concentration of DNA was ascertained using fluorescence methods (Picogreen, LifeTechnologies). Libraries were constructed using the Illumina TruseqDNA PCR free sample prep kit and evaluated with the Agilent Tape Station 2200. DNA fragments were quantified by Picogreen and normalized to 10 nM as recommended by Illumina for clusters generation on the Hiseq2000 sequencer. After that, the denaturation of libraries was performed, and samples were run in 32 lanes of the Hiseq Flowcell. Clusters were generated using the IlluminaTruseq PE cluster kit v3 and the hybridized libraries were sequenced on the Hiseq2000 sequencer with a 100 cycles of paired-end sequencing module using the Truseq SBS kit v3. The total number of raw reads generated for a single animal varied between 164,984,147 and 472,265,620. The data is publicly available through the NCBI BioProject data base under the accession ID: PRJNA359667 [Szyda et al. 2015Szyda, J., Frąszczak, M., Mielczarek, M., Giannico, R., Minozzi, G. et al. (2015). The assessment of inter-individual variation of whole-genome DNA sequence in 32 cows. Mamm. Genome, 26(11–12), 658–665. https://doi.org/10.1007/s00335-015-9606-7.].
Based on this data set copy number variants were detected with the pipeline comprising: (i) an alignment to the UMD3.1 reference genome [Zimin et al. 2009Zimin, A.V., Delcher, A.L., Florea, L., Kelley, D.R., Schatz, M.C. et al. (2009). A whole-genome assembly of the domestic cow, Bos taurus. Genome Biol., 10(4), R42. https://doi.org/10.1186/gb-2009-10-4-r42.], (ii) alignment post processing, and (iii) CNV detection. In the first step, the BWA-MEM software [Li and Durbin 2009Li, H., Durbin, R. (2009). Fast and accurate short read alignment with Burrows-Wheeler transform. Bioinformatics, 25, 1754–1760. https://doi.org/10.1093/bioinformatics/btp324.] was used to align short reads against the UMD3.1 reference genome. The second step included converting the SAM format into the BAM format, merging BAM files, sorting reads, removing PCR duplicates, and indexing data, which was performed by applying selected tools from the Picard (http://broadinstitute.github.io/picard/) and SAMtools [Li et al. 2009Li, H., Handsaker, B., Wysoker, A., Fennell, T., Ruan, J., et al. (2009). The Sequence alignment/map (SAM) format and SAMtools. Bioinformatics, 25, 2078–2079. https://doi.org/10.1093/bioinformatics/btp352.] packages. In the final step, the CNVnator software [Abyzov et al. 2011Abyzov, A., Urban, A.E., Snyder, M., Gerstein, M. (2011). CNVnator: An approach to discover, genotype, and characterize typical and atypical CNVs from family and population genome sequencing. Genome. Res., 21, 974–984. https://doi.org/10.1101/gr.114876.110.], which identifies genomic regions with especially high and especially low coverage and respectively assigns them as CNV duplications and deletions, was used for variant detection. This implies that variants were defined in comparison to the UMD3.1 reference genome. CNVs were identified following a recommendation of Abyzov et al. [2011Abyzov, A., Urban, A.E., Snyder, M., Gerstein, M. (2011). CNVnator: An approach to discover, genotype, and characterize typical and atypical CNVs from family and population genome sequencing. Genome. Res., 21, 974–984. https://doi.org/10.1101/gr.114876.110.], thus a 100 bp window was used for coverage comparisons. As a consequence, CNV breakpoints (i.e. bp marking a begin or an end of a CNV) were identified with a resolution of 200 bp. Altogether, 747,610 CNV deletion breakpoints and 123,578 CNV duplication breakpoints were investigated.
Each CNV breakpoint location was mapped to the UMD3.1 reference genome, which has recently been replaced by the ARS-UCD1.2 reference genome. Paradoxically, we focused on the UMD3.1 due to its lower quality, especially in terms of sequence continuity, as expressed by N50 and L50 statistics (N50:103,308,737/6,380,747 and L50:12/107 for ARS-UCD1.2 and UMD3.1 respectively), which allows for a better assessment of the influence of missing base pairs on the detection of false-positive deletions. Breakpoints were defined with the resolution of 200 bp as implemented in the CNVnator software. Therefore, for each breakpoint position, a 400 bp long reference sequence fragment (200 bp upstream and 200 bp downstream of a breakpoint position) was isolated from the reference genome. CNVs located in telomeric regions, with no 200 bp down- or up-stream available, were excluded from the analysis.
The quality of each 400 bp sequence was expressed by the number of unknown base pairs, marked by "N" in the reference genome. The complexity of sequences with less than 1% (i.e. < 4) unknown nucleotides was quantified by the number of nucleotide changes. Therefore, the minimum possible complexity was zero and the maximum was 399. Providing a 4-base sequence as an example, the complexity measure is 3 for a “ACTA” sequence, 2 for a “TTCA” sequence, and zero for a “AAAA” sequence. A “reference” level of complexity, reflecting a random complexity of a 400 bp long sequence in the Bos taurus genome, was assessed by permuting (i.e. randomly shuffling) each of the 400 bp sequences 1,000 times, and averaging all corresponding complexity coefficients.
The normality of the distribution of sequence quality and complexity measures was assessed with the Cramér–von Mises test with the underlying hypothesis (H0) defined as: quality/complexity measures follow a standard Normal distribution. The test statistic was expressed as: $$W^2=\frac{1}{12n}+\sum_{i=1}^{n} \Big (F(x)-\frac{2i-1}{2n}\Big)^2,$$where F represented the standard normal distribution function and xi were sequence quality/complexity measures transformed to mean zero and variance equal to one, sorted from i to n in an increasing order. The underlying null-distribution of the test was defined by Stephens [1974Stephens, M.A. (1974). EDF Statistics for Goodness of Fit and Some Comparisons. J. Am. Stat. Assoc., 347, 730–737. https://doi.org/10.1080/01621459.1974.10480196.].
Further on, the differences in the distributions of sequence quality/complexity measures were tested using the Kolmogorov-Smirnov test based on a distance between two empirical distribution functions: $$D_{n,m}=\sup\limits_{x}|F_n(x)-G_m(x)|.$$The underlying null hypothesis assumes the equality of both distributions ends is defined as: $$H_0:F(x)=G(x).$$ Under H0, the probability $$P\Big(\sqrt\frac{n\cdot m}{n+m}D_{n,m}\leq y \Big)$$ asymptotically follows the Kolmogorov distribution function: $$Q(x)=1-2\sum_{j=1}^{\infty}(-1)^{j-1}e^{-2j^2x^2}.$$ In this study the comparison corresponded either to sequence complexity measure distribution in real data [F(x)] vs. sequence complexity measure distribution in permuted data [G(x)], or to the distribution of sequence quality in deletions [F(x)] vs. the distribution of sequence quality in duplications [G(x)].
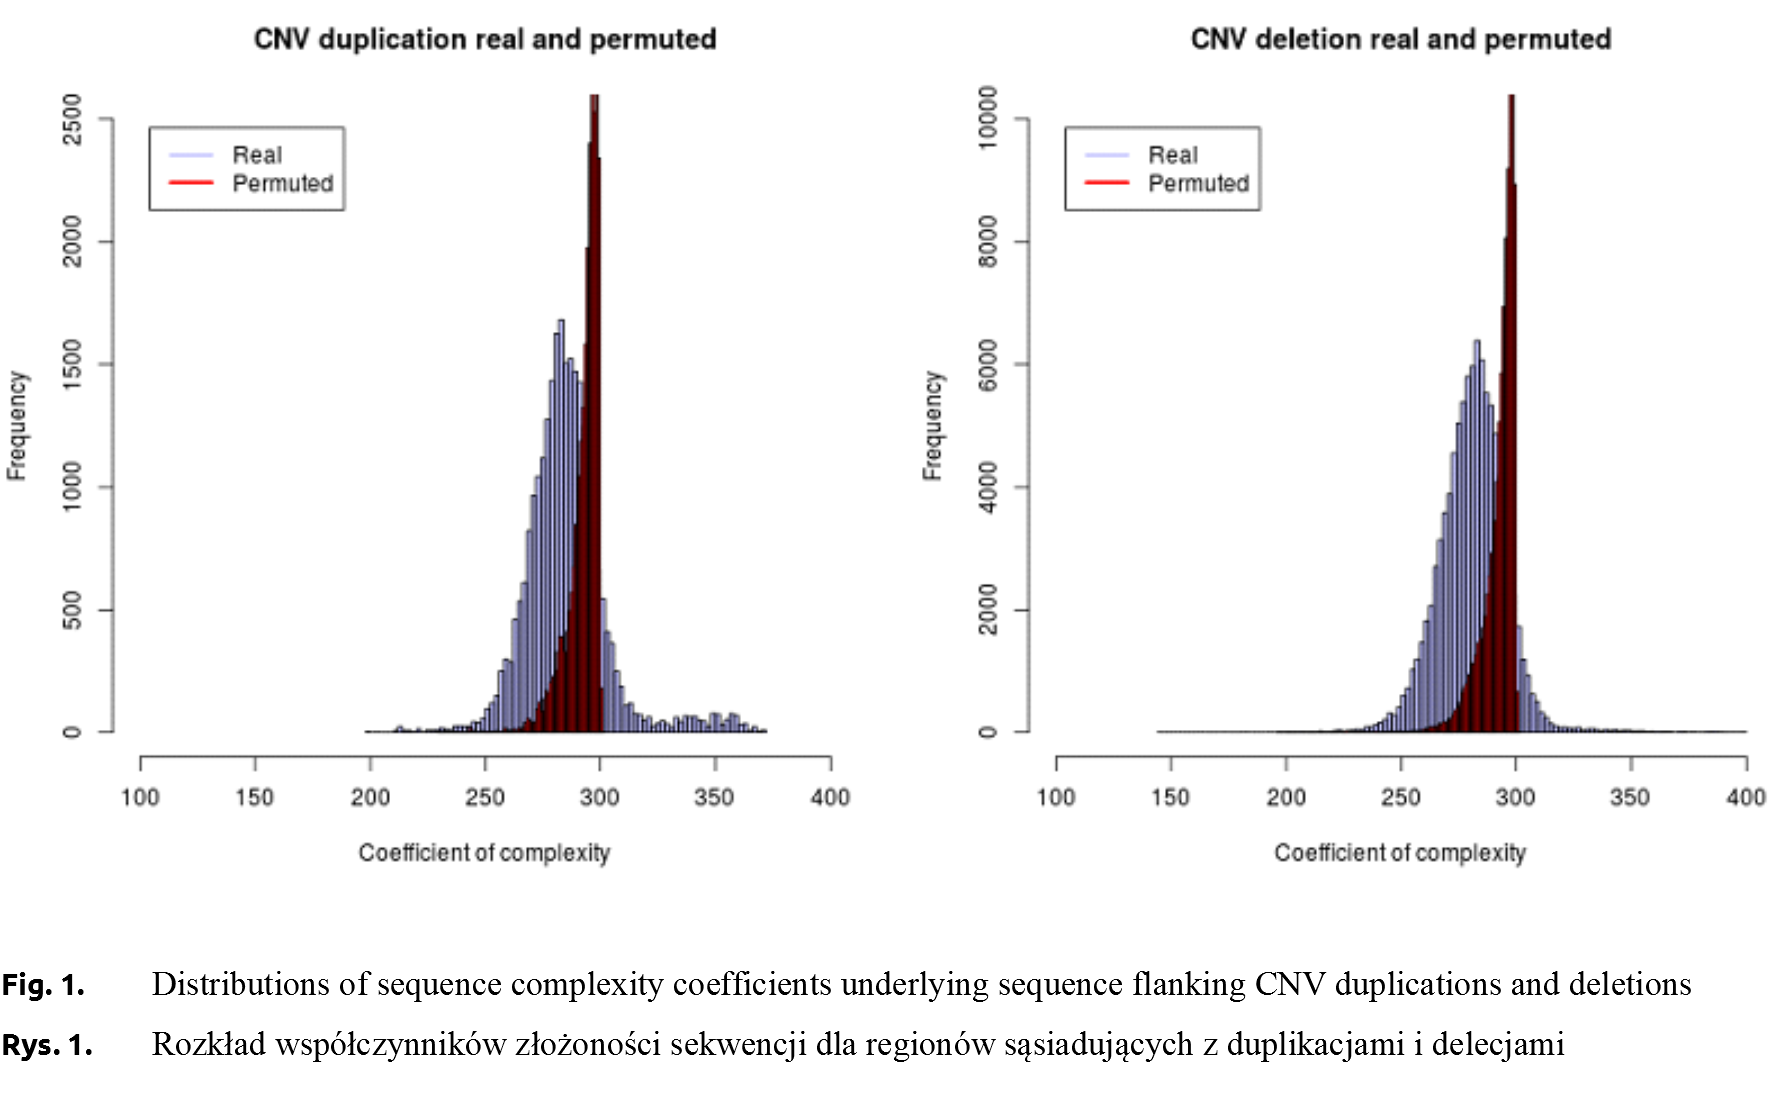
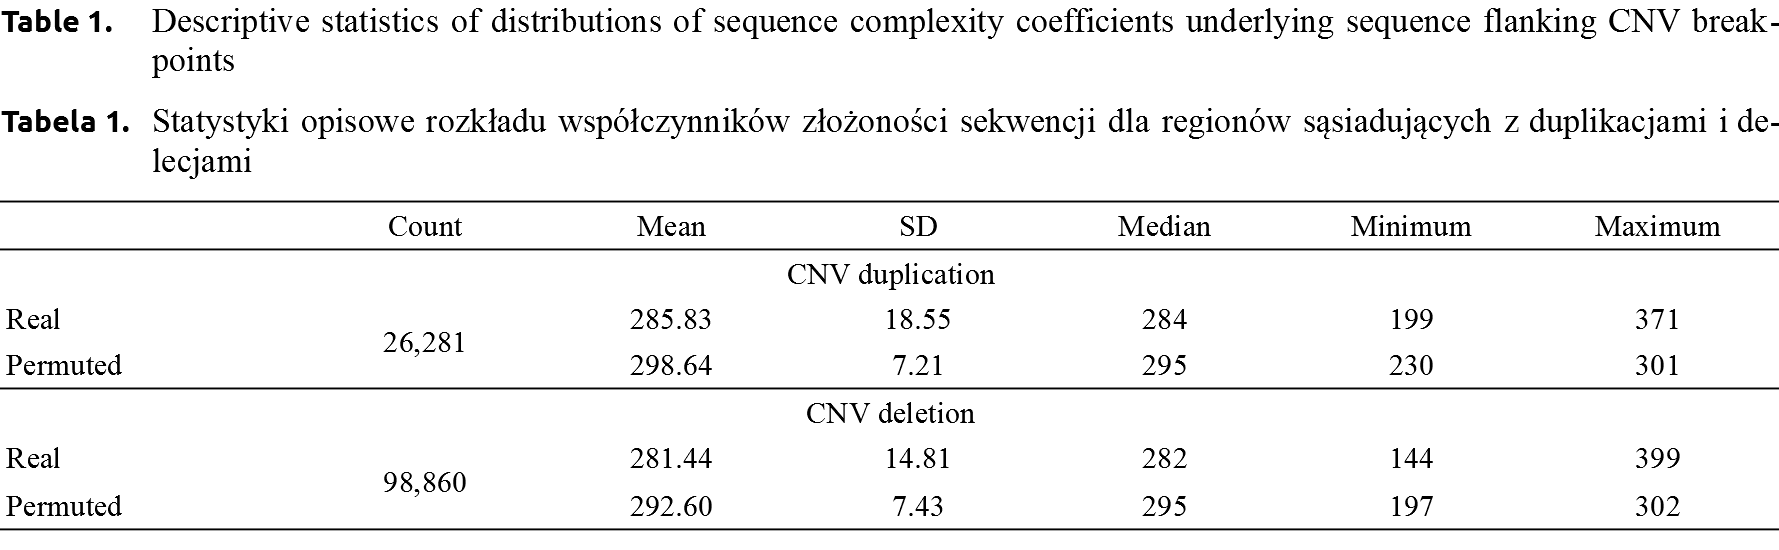
CNV duplications. The complexity measures of the 400 bp flanking duplication breakpoints ranged between 199 and 371 (285.83 ±18.55). For the “reference” sequence underlying CNV deletion breakpoints constructed by permutations the complexity measure varied between 230 and 301 with an average of 298.64 ±7.21 (Table 1). In order to assess whether sequence complexity observed near CNV duplication breakpoints differs from the “reference” complexity, probability distributions of both complexity measures were compared, revealing highly significant (P < 10–15) differences. A visual assessment of distributions, shown in Figure 1, indicated that DNA sequence flanking true CNV duplication breakpoints had a higher variance than that of permuted sequences. Moreover, the probability density distribution of complexity measures underlying true duplication breakpoints was moved towards lower values as compared to the probability density distribution corresponding to permuted sequences.
CNV deletions.The complexity of sequence flanking deletions ranged from 144 to 399 (281.44 ±14.81), while the corresponding mean of complexity measures underlying permuted sequences flanking deletion breakpoints was 292.60 ±7.43 (197-302) (Table 1). The differences between distributions of complexity measures underlying permuted and true sequences, visualised on Figure 1, were significant (P < 10–15). As for duplications, there was higher variability of complexity measures among true then among permuted sequences. In addition, there was a higher probability to observe a low sequence complexity near a true deletion breakpoint, than in a permuted sequence – a phenomenon already reported above for duplications.

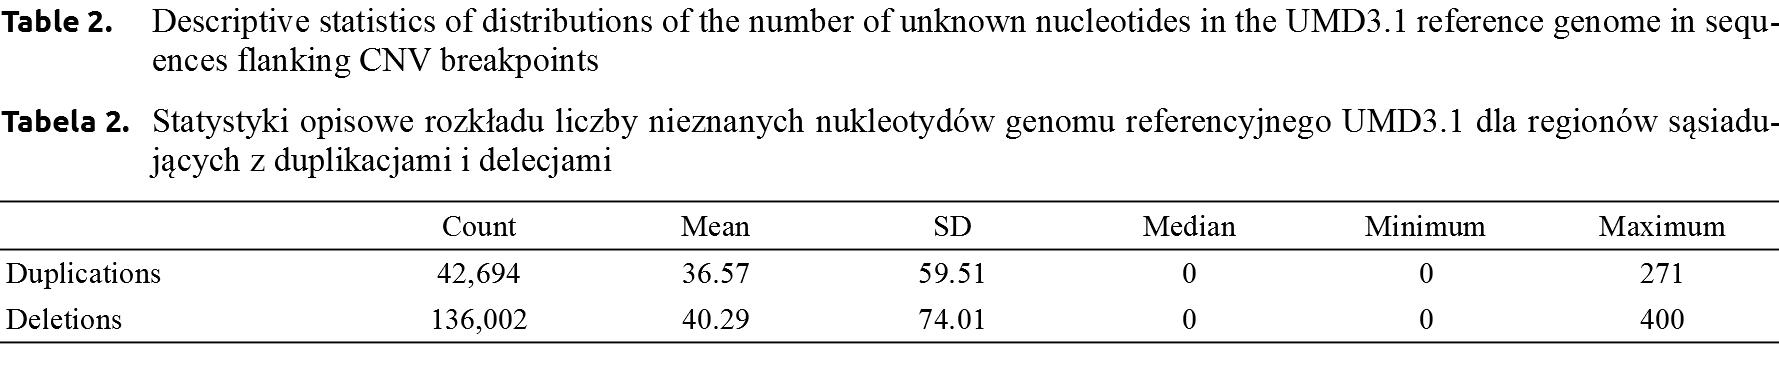
The highest number of unknown nucleotides among the 400 bp flanking CNV duplication breakpoints was 271, with the mean of 36.57 ±36.57. In case of deletions many more unknown nucleotides were present in the flanking sequences – with a single CNV deletion begin consisting entirely of Ns. The mean number of unknown bp in deletion breakpoints was higher than for duplications and amounted to 40.29 ±74.01 (Table 2). Moreover, as visualised on Figure 2, for deletions and duplications, a large number of breakpoint flanking regions consisted of either complete sequences (i.e. all nucleotides known) or sequences with 100 unknown bp.
The latter do not consist of exactly 100 unknown base pairs, but correspond to gap sizes of varying unknown length, which are represented by 100 Ns in reference genomes (GeneBank https://www.ncbi.nlm.nih.gov/genbank/wgs_gapped/#all_unknown). Moreover, Figure 2 visualises an overall higher number of unknown nucleotides in sequences flanking deletion breakpoints as compared to duplication breakpoints.The comparison of distributions of the number of unknown nucleotides contained in flanking sequences underlying CNV deletions and CNV duplications was significant (P < 10–15).
As postulated by [Carvalho and Lupski 2016], the incidence of CNV breakpoints is not randomly distributed along the genome. Many authors analysed the biological aspects of CNV formation in relation to features of local genomic architecture at breakpoint sites (see e.g. the reviews of Carvalho and Lupski 2016Carvalho, C.M.B., Lupski, J.R. (2016). Mechanisms underlying structural variant formation in genomic disorders. Nat. Rev. Genet., 17, 224–238. https://doi.org/10.1038/nrg.2015.25. and Cardoso et al. 2016Cardoso, M.O., Amorim, A., Azevedo, L. (2016). Major influence of repetitive elements on disease-associated copy number variants (CNVs). Hum. Genomics, 10, 30. https://doi.org/10.1186/s40246-016-0088-9.) or the systematic analysis of Abyzov et al. [2015Abyzov, A., Li, S., Kim, D.R., Mohiyuddin, M., Stütz, A.M. et al. (2015). Analysis of deletion breakpoints from 1,092 humans reveals details of mutation mechanisms. Nat. Commun., 6(1), 7256. https://doi.org/10.1038/ncomms8256.]. Among many genome sequence features postulated for the promotion of CNV breakpoint formation, the presence of low copy repeats was raised. In our study LCR regions were “translated” into the level of sequence complexity at regions underlying CNV breakpoints and appeared to be significantly associated with deletion and duplication breakpoints. However, besides biology, in working with data derived from high-throughput technologies (such as the new generation sequencing data analysed here), the technical aspect of data processing is an important factor. For instance, Shin et al. [2014Shin, D.-H., Lee, H.-J., Cho, S., Kim, H.J., Hwang, J.Y. et al. (2014). Deleted copy number variation of Hanwoo and Holstein using next generation sequencing at the population level. BMC Genomics, 15(1), 240. https://doi.org/10.1186/1471-2164-15-240.] positively validated only 80% of CNV deletions using PCR. In addition, Bickhart et al. [2012Bickhart, D.M., Hou, Y., Schroeder, S.G., Alkan, C., Cardone, M.F. (2012). Copy number variation of individual cattle genomes using next-generation sequencing. Genome. Res., 22, 778–790. https://doi.org/10.1101/gr.133967.111.] and Choi et al. [2014Choi, J.-W., Liao, X., Stothard, P., Chung, W.-H., Jeon, H.-J., Miller, S.P. (2014). Whole-Genome Analyses of Korean Native and Holstein Cattle Breeds by Massively Parallel Sequencing. PLoS ONE, 9, e101127. https://doi.org/10.1371/journal.pone.0101127.] reported a similar true positive rate (82%) for CNVs. In this study, we considered the impact of genome quality expressed by the number of unknown nucleotides on false positive detection of CNV deletions. Significant abundances of N bp between deletions and duplications confirmed the hypothesis that CNV detection software based on a read-depth algorithm, such as implemented in the CNVnator, is sensitive to genomic regions with low quality sequence information – where an appropriate alignment of short sequence reads is impossible. Resulting differences in sequence read depth (i.e. the local coverage of the reference genome by reads) postulate a CNV deletion, which has high probability of being a false positive.
Because of their length, CNVs may have a potentially high impact on phenotypes. They appear to be preferentially initiated in regions of low sequence complexity. Nevertheless, CNV detection based on WGS data is still a big challenge. As results of this and other studies, the accuracy of CNV detection is low because of false positive calls for deletions being the result of reference genome incompleteness. This problem can be to some extend circumvented by applying CNV detection software, which use various variant calling criteria, such as read depth, insert size length, or split read identification and deriving a consensus data set and by improving the reference genome.
The research was supported by the European Union Seventh Framework Programme through the NADIR (FP7-228394) project, by the Polish National Science Centre (NCN) grant 2014/13/B/NZ9/02016. We also acknowledge Poznan Supercomputing and Networking Centre for hosting the large computations.
Received: 15 Apr 2019
Accepted: 20 Jul 2019
Published online: 25 Oct 2019
Accesses: 1175
Barski, P., Mielczarek, M., Frąszczak, M., Szyda, J., (2019). DNA sequence features underlying copy number variants. Acta Sci. Pol. Zootechnica, 18(2), 25–30. DOI: 10.21005/asp.2019.18.2.04.