
Research Article
Stanisław Socha ![]() , Ewa Kozakiewicz, Dorota Kołodziejczyk
, Ewa Kozakiewicz, Dorota Kołodziejczyk ![]()
Faculty of Agrobioengineering and Animal Husbandry, Siedlce University of Natural Sciences and Humanities, B. Prusa 12/14, 08-110 Siedlce, Poland
Abstract. The aim of the study was to analyze selected parameters influencing the technological and sensory quality of pork. The material for the study was pork from the ham muscle and the ribeye muscles. The raw material came from a meat processing plant located in north-eastern Poland. The research was carried out on 80 porkers from various farms and farms. The tests included pH in 45 minutes and 24 hours from slaughter, meat color, water holding capacity, and the chemical composition of meat. It was found that half of the porkers had a lean content of more than 50%, and the best distinction between meat of normal quality and other quality classes results from the use of two or three different evaluation methods. The measurements of color and pH are most useful in assessing the quality of meat, but for the classification to be precise, some of them must be carried out immediately on the slaughter and as soon as the carcasses have cooled down. The brightness of the meat and the final pH values enable distinguishing between DFD meat and PSE meat. The color of normal meat is very similar to that of meat with the RSE defect. Significant (P ≤ 0.01) relationships were found between the protein content and the pH of the meat measured 45 minutes and 24 hours after slaughter. Significant relationships (P ≤ 0.01) also occurred between the values of the parameter a* and b* (trichromaticity coordinates).
Keywords: pork, meat quality, meat defects, pH
Pig farming represents the largest sector of the animal production in Poland. Przybylski et al. [2012]Przybylski, W., Jaworska, D., Boruszewska, K., Borejko, M., Podsiadły, W. (2012). Jakość technologiczna i sensoryczna wadliwego mięsa wieprzowego [Technological and sensory quality of defective pork]. Żywność. Nauka. Technologia. Jakość, 1(80), 116 – 127 [in Polish]. Google Scholar report that pork constitutes more than a half of the total meat consumed in Poland. However, in terms of quality, pork may not always be fully acceptable by consumers. When purchasing meat, the consumer pays attention to its color, tenderness, smell, juiciness and sensory values. Recently, an improvement in the carcass lean content in pigs has been observed; this, however, has been at the expense of generally deteriortated quality of the product [Pospiech and Lisiak 2012Pospiech, E., Lisiak, D. (2012). Meat faults; Their causes and effect and possibilities for preventing their occurrence. Proc. VIth Int. Sci. Symp.: Application of scientific researches in pig production improvement and their influence on rural areas development. Bydgoszcz-Toruń, 46–47. Google Scholar].
The main technological quality defects of meat include those resulting from improper course of the glycolysis process [Sionek and Przybylski 2015Sionek, B., Przybylski, W. (2015). Wpływ czynników środowiskowych na poziom glikogenu w mięśniach zwierząt rzeźnych [Influence of environmental factors on the level of glycogen in muscles of slaughter animals]. Żywność. Nauka. Technologia. Jakość, 1(98), 35–48 [in Polish]. Google Scholar]. Due to an insufficient amount of glycogen in the muscles during slaughter, its pH does not drop and DFD meat is an outcome. It is characterized by an unnaturally dark red color and a hard and dry structure [Przybylski et al. 2012Przybylski, W., Jaworska, D., Boruszewska, K., Borejko, M., Podsiadły, W. (2012). Jakość technologiczna i sensoryczna wadliwego mięsa wieprzowego [Technological and sensory quality of defective pork]. Żywność. Nauka. Technologia. Jakość, 1(80), 116 – 127 [in Polish]. Google Scholar]. On the other hand, a sharp decrease in meat pH within 45 minutes post-slaughter produces PSE meat, of a brighter, unnaturally pale color, with very low water absorption, including own meat juices, which causes a high drip and a cross-section surface is wet and non-cohesive, inelastic and softened structure [Strzelecki 2006Strzelecki, J. (2006). Rozkład mięsa bladego (PSE) w mięśniach szkieletowych tuszy wieprzowej [Distribution of pale (PSE) meat in skeletal muscle of the pork carcass]. Gosp. Mięs., 58(2), 20–26 [in Polish]. Google Scholar, Chmiel et al. 2011Chmiel, M., Słowiński, M., Cal, P. (2011). Zastosowanie komputerowej analizy obrazu do wykrywania wady PSE mięsa wieprzowego [Application of computer image analysis to detect the PSE defect of pork]. Żywność. Nauka, Technologia, Jakość, 6(79), 47–54 [in Polish]. Google Scholar]. On the other hand, ASE meat is characterized by a very low pH (below 5.4), which persists for 3 hours after slaughter. Sour meat has a light color and shows high water drip. The main reason of this defect is a very high glycolytic potential, mainly a high glycogen content in the muscles, already present in the live animal [Zybert 2016Zybert, A. (2016). Zmienność zasobów glikolitycznych mięśnia longissimus lumborum w 45 minut po uboju a wartość wybranych cech jakości mięśnia wieprzowego. Monografia naukowa [Variability of glycolytic resources of longissimus lumborum muscle 45 minutes after slaughter and the value of selected quality characteristics of pork. Monograph]. UPH w Siedlcach [in Polish]. Google Scholar]. Changes of this type occur in muscle tissue as a result of improper handling of the animals, both before and after slaughter [Jurczak 2005Jurczak, M. (2005). Ocena jakości mięsa; Ocena surowców pochodzenia zwierzęcego [Meat quality evaluation; Assessment of raw materials of animal origin]. SGGW, Warszawa [in Polish]. Google Scholar, Pisula and Florowski 2006Pisula, A., Florowski, T. (2006). Critical points in the development of pork quality – a review. Pol. J. Food Nutr. Sci., 15(56), 3, 249–256. Google Scholar]. The various stressors and the way they affect the body during period preceeding the slaughter have been the subject of many studies [Bertol et al. 2006Bertol, T.M., Ellis, M., Ritter, M.J., McKeith, F.K., Hamilton, D.N. (2006). Variation in glycolitic potential and fresh pork quality traits along the longissimus dorsi of slaughter weigh pigs. J. Muscle Foods, 17(3), 237–247. https://doi.org/10.1111/j.1745-4573.2006.00042.x, Correa et al. 2010Correa, J.A., Torrey, S., Devillers, N., Laforest, J.P., Gonyou, H.W., Faucitano, L. (2010). Effects of different moving devices at loading on stress response and meat quality in pigs. J. Anim. Sci., 12(88), 4086–4093. https://doi.org/10.2527/jas.2010-2833, Probst et al. 2012Probst, J.K., Spengler, N.A., Leiber, F., Kreuzer, M., Hillmann, E. (2012). Gentle touching in early life reduces avoidance distance and slaughter stress in beef cattle. Appl. Anim. Behav. Sci., 1–2, 42–49. https://doi.org/10.1016/j.applanim.2012.03.002]. They are the main factors stimulating the neurohormonal system of the body, which results in the loss of physiological balance and acceleration of metabolic changes. An improperly conducted ante-mortem handling elevates the rate of PSE or DFD.
Too many or too few pigs per unit area cause a decrease in pH of the meat, as measured 30 minutes after slaughter [Vermeulen et al. 2015Vermeulen, L., van de Perre, V., Permentier, L., De Bie, S., Verbeke, G., Geers, R. (2015). Pre-slaughter handling and pork quality. Meat Sci., 100, 118–123. https://doi.org/10.1016/j.meatsci.2014.09.148]. As shown by Guàrdia et al. [2004]Guàrdia, M.D., Estany, J., Balasch, S., Oliver, M.A., Gispert, M., Diestre, A. (2004). Risk assessment of PSE condition due to pre-slaughter conditions and RYR1 gene in pigs. Meat Sci., 67(3), 471–478. https://doi.org/10.1016/j.meatsci.2003.11.020 shorter transport time combined with too low density of animals increased the risk of the PSE defect.
An important element influencing the quality of meat is also the method of stunning and bleeding. According to Koćwin-Podsiadła and Krzęcio [2005]Koćwin-Podsiadła, M., Krzęcio, E. (2005). Jakość wieprzowiny i metody jej doskonalenia. Cz. III. Metody poprawy cech jakości mięsa [Pork quality and methods of its improvement. Part III. Methods of improving the quality characteristics of meat]. Prz. Hod., 6, 3–6 [in Polish]. Google Scholar, stunning with carbon dioxide instead of electric current generates less stress in pigs, and bleeding in the lying position instead of hanging reduces the incidence of defective meat.
The opinions on the impact of the housing system on the quality of meat raise many controversies. In general, no significant effect of the level of nutrition has been found in relation to most of the essential characteristics of the technological and organoleptic quality of pork. Massive, large-scale production and intensive fattening, using excessives dose of carbohydrates, are believed to increase the rates of watery structure of meat [Rosenvold et al. 2001Rosenvold, K., Peterson, J.S., Laerke, H.N., Jensen, S.K., Therkildsen, M., Karlsson, A.H., Moller, H.S., Andersen, H.J. (2001). Muscle glycogen stores and meat quality as affected by strategie finishing feeding of slaughter pigs. J. Anim. Sci., 2(79), 382–391. https://doi.org/10.2527/2001.792382x]. According to Łyczyński et al. [2003]Łyczyński, A., Pospiech, E., Bartkowiak, Z., Urbaniak, M. (2003). Mięsność i jakość mięsa w zależności od genotypu i systemu żywienia świń [Meat content and meat quality depending on the genotype and feeding system of pigs]. Żywność, 4(37) Supl., 287–298 [in Polish]. Google Scholar, ad libitum feeding of pigs did not significantly reduce the post-slaughter meatiness of their carcasses and had a positive effect on the quality of the meat. With a restrictive feeding system, on the other hand, the highest share of defective meat of the PSE and ASE type was recorded.
The season and the related weather are some of the most important factors determining the quality of meat. The meat of porkers slaughtered in the spring and summer and in early autumn is characterized by higher acidification and greater water drip. Meat with PSE defect is most common in spring and summer, while DFD in autumn and winter [Čbanović et al. 2016Čbanović, N., Bošković, M., Vasilev, D., Dimitrijević, M., Parunović, N., Djordjević, J., Karabasil, N. (2016). Effects of various pre-slaughter conditions on pig carcasses and meat quality in a low-input slaughter facility. S. Afr. J. Anim. Sci., 46, 380–390. https://doi.org/10.4314/sajas.v46i4.6].
The research by Koćwin-Podsiadła et al. [2001]Koćwin-Podsiadła, M., Krzęcio, E., Zybert, A. (2001). Utilization of molecular genetic achievements in pork quality improvement. Pol. J. Food Nutr. Sci., 10/51(3), 11–18. Google Scholar shows that of all the factors influencing meat quality, environmental effects account for about 70% on average, and the rest may be attributed to genetic factors, of which the genotype of the animal is usually decisive. The incidence of PSE and DFD meat defects largely depends on the susceptibility to stress of different breeds of pigs. The sensitivity of pigs to stress is conditioned by the recessive gene, the locus of which was named HAL. The recessive allele responsible for the occurrence of pig stress syndrome has the symbol HALn [Stepanow et al. 2019Stepanow, K.P., Urbański, P., Sieczkowska, H., Pierzchała, M. (2019). Przyczyny powstawania wady mięsa typu PSE i ich wpływ na jakość wieprzowiny [Causes of for the PSE defect in meat and their impact on the quality of pork]. Prz. Hod., 1, 4–14 [in Polish]. Google Scholar].
Duroc is considered to be a stress-sensitive breed. A very low percentage of stress-sensitive pigs are found in Yorkshire, Large White and Hampshire breeds. The highest incidence of PSE meat are found in the groups of top conformation and extremely burdened with the gene HALn, i.e. Pietrain [Stepanow et al. 2019Stepanow, K.P., Urbański, P., Sieczkowska, H., Pierzchała, M. (2019). Przyczyny powstawania wady mięsa typu PSE i ich wpływ na jakość wieprzowiny [Causes of for the PSE defect in meat and their impact on the quality of pork]. Prz. Hod., 1, 4–14 [in Polish]. Google Scholar]. Various methods are used in the pork industry to assess the quality of meat and detect its defects. According to Pospiech [2000]Pospiech, E. (2000). Diagnozowanie odchyleń jakościowych mięsa [Diagnosing meat quality deviations]. Gosp. Mięsna, 4, 68–71 [in Polish]. Google Scholar, Strzelecki [2006]Strzelecki, J. (2006). Rozkład mięsa bladego (PSE) w mięśniach szkieletowych tuszy wieprzowej [Distribution of pale (PSE) meat in skeletal muscle of the pork carcass]. Gosp. Mięs., 58(2), 20–26 [in Polish]. Google Scholar and Warris et al. [2006]Warris, P. D., Brown, S. N., Paściak, P. (2006). The colour of the adductor as a predictor of pork quality in the loin. Meat Sci., 73,4, 565–569. https://doi.org/10.1016/j.meatsci.2006.02.009, these include laboratory methods (e.g., determination of enzyme activity in blood plasma, concentration of metabolites, such as lactate, inosine), sensory methods (e.g. determination of color and brittleness), and methods that can be used in the slaughter line (e.g. pH measurement 45 minutes after slaughter, measurement of electrical properties, such as conductivity, active resistance, or optical properties, like color components.
One of the methods of assessing carcasses currently used is computer image analysis (CIA). This method consists in taking a digital photograph and determining the meat quality parameters using a software package. Du and Sun [2004]Du, C. J., Sun, D. (2004). Recent developments in the applications of image processing techniques for food quality evaluation. Trends Food Sci. Tech., 15, 230–249. https://doi.org/10.1016/j.tifs.2003.10.006 and Faucitano et al. [2005]Faucitano, L., Huff, P., Teuscher, F., Gariepy, C., Wegner, J. (2005). Application of computer image analysis to measure pork marbling characteristics. Meat Sci., 69, 537–543. https://doi.org/10.1016/j.meatsci.2004.09.010 used this method to evaluate the marbling and tenderness of pork. In turn, Lu et al. [2000]Lu, J., Tan, J., Shatadal, P., Gerrard, D.E. (2000). Evaluation of pork color by using computer vision. Meat Sci., 56, 57–60. https://doi.org/10.1016/S0309-1740(00)00020-6, as well as Wu and Sun [2013]Wu, D., Sun, D. W. (2013). Colour measurements by computer vision for food quality control – A review. Trends Food Sci. Technol., 29, 5–20. https://doi.org/10.1016/j.tifs.2012.08.004 used CIA to measure the color of pork. Chmiel et al. [2000]Chmiel, M., Słowiński, M., Dasiewicz, K. (2000). Lightness of the color measured by computer image analysis as a factor for assessing the quality of pork meat. Meat Sci., 88, 566–570. https://doi.org/10.1016/j.meatsci.2011.02.014 found that the CIA method allows detecting PSE and DFD defects in pork.
The aim of the study was to analyze selected parameters of technological quality and sensory properties of pork.
The material was pork samples from the muscles of the ham and the ribeye muscles. The raw material was obtained from a meat-processing plant located in north-eastern Poland. The research was carried out on 80 fatteners (interracial hybrids) from farms of various sizes, arriving at the plant at the same time. The pigs were slaughtered after 24 hours of rest (from the moment they were delivered to the meat processing plant). The animals rested in clean and air-conditioned rooms. Immediately after slaughter, suspended split-carcasses were cooled with the air system at a temperature of +4℃. After 24-hour cooling, the carcasses were dissected into basic cuts, of which the ribeye muscle (Longissimus dorsi, LD) and the ham muscle (Semimembranosus, SM) were examined. The analyses included: pH in 45 minutes and 24 hours post-slaughter, meat color, water-holding capacity, and chemical composition of meat. Evaluation of lean content was estimated with the use of the ULTRA-FOM apparatus (SKF-Technology).
Water content was determined in accordance with PN-73/A-82110 [Polska Norma 1973aPolska Norma (1973a). PN-73/A-82110. Mięso i przetwory mięsne. Oznaczanie zawartości wody. Google Scholar]. For this purpose the drying technique was used, which consists in determining the test substance before and after drying in the oven. Drying and weighing are carried out until constant weight is obtained. The water content is determined by the mass loss during drying [Polska Norma 1973bPolska Norma (1973b). PN-73/A-82111. Mięso i przetwory mięsne. Oznaczanie zawartości tłuszczu. Google Scholar].
Total protein content measurements were carried out in accordance with PN-75/A-04018 [Polska Norma 1975Polska Norma (1975). PN-75/A-04018. Mięso i przetwory mięsne. Oznaczanie azotu metodą Kjeldahla i przeliczanie na białko. Google Scholar], using the Kjeldahl method. Fat content was determined using the technical method (Gerbera) according to PN-73/A-82111 [Polska Norma 1973bPolska Norma (1973b). PN-73/A-82111. Mięso i przetwory mięsne. Oznaczanie zawartości tłuszczu. Google Scholar]. Measurements of pH was carried out according to PN-77/A-82058 [Polska Norma 1977Polska Norma (1977). PN-77/A-82058. Mięso i przetwory mięsne. Oznaczanie pH mięsa. Google Scholar]. For this purpose, a CP-315M pH-meter with a glass-calomel composite electrode was used. The pH was determined by inserting the electrode into the ribeye muscle (LD) between the last thoracic and first lumbar vertebrae, and into the ham muscle (SM). The measurements were carried out on 80 carcasses.
Color brightness was measured by the reflection method using the Minolta CR-200 spectrometer. Meat samples 1 cm thick were transferred to petri dishes with a diameter of 5 cm. In the samples prepared in this way, color measurements were made at three different points. The results obtained in this way were averaged. Three color components were measured: a*, b*, L*. The a* and b* values are trichromaticity coordinates and indicated with plus and minus. Value +a* corresponds to red, –a* to green, +b* to yellow, –b* to blue. The size L* indicates the brightness of the color and its values vary from 100 for perfect white to 0 for black.
Native water holding capacity was analysed using filter paper to absorb the meat juice released (separated) from a meat sample when exposed to force. About 1 gram of comminuted meat was weighed onto polyethylene film and transferred to a paper disc (conditioned for 24 hours over an aqueous solution of KCl). The water-holding capacity of the meat was calculated from the difference in the area. The result was related to 1 gram of meat (cm/g).
Arithmetic means, standard deviations and coefficients of variation were calculated for each of the examined traits. Phenotypic correlations were also estimated for the following traits: meatiness, pH, meat color, content of protein, water and fat in it. The calculations were made using the specialized statistical package STATISTICA [Statsoft 2009Statsoft (2009). STATISTICA 12. Statsoft Inc. Google Scholar].
In the studied pig population, the mean meat content was 50.1%. The mean pH45 LD value was 6.21, while the pH24 LD was 5.75. The average value for the brightness of the L color in the assessed material is 47.32 (Table 1).
Table
1. Statistical
description of pork quality
characteristics in the analyzed meat processing plant |
|||||
Trait |
Basic trait description – Charakterystyka podstawowych cech |
||||
Number, n |
Arithmetic
mean |
Standard deviation, s |
Coefficient of variability,
% |
||
Lean content, % – Mięsność, % |
80 |
50.09 |
7.153 |
14.3 |
|
pH24 LD |
80 |
5.75 |
0.246 |
4.3 |
|
pH24 SM |
80 |
5.77 |
0.250 |
4.3 |
|
pH45 LD |
80 |
6.21 |
0.210 |
3.4 |
|
Meat color characteristics |
L* |
80 |
47.32 |
2.742 |
5.8 |
a* |
80 |
18.34 |
1.511 |
8.2 |
|
b* |
80 |
10.04 |
1.726 |
17.2 |
|
Protein content – Zawartość białka |
80 |
20.08 |
2.450 |
12.2 |
|
Water content – Zawartość wody |
80 |
72.98 |
1.840 |
2.5 |
|
Fat content – Zawartość tłuszczu |
80 |
2.82 |
1.250 |
44.3 |
|
LD
– Longissimus
dorsi, SM
– Semimembranosus,
L* – color brightness, a*, b* – trichromaticity
coordinates. |
|||||
Table
2. Percentage
distribution of pH45 and
pH24 values |
|||
pH45 |
Percent of animals – Procent zwierząt |
pH24 |
Percent of animals – Procent zwierząt |
< 5.59 |
6 |
< 5.0 |
1 |
5.95–6.05 |
21 |
5.0–5.2 |
3 |
6.05–6.15 |
19 |
5.2–5.4 |
6 |
6.15–6.25 |
9 |
5.4–5.6 |
10 |
6.25–6.35 |
16 |
5.6–5.8 |
24 |
6.35–6.45 |
13 |
5.8–6.0 |
52 |
6.45–6.55 |
10 |
6.0–6.2 |
3 |
≥ 6.55 |
6 |
≥ 6.2 |
1 |
|
100 |
|
100 |
Table
3. Percentage
distribution of color in the tested material |
|||||
Color brightness
distribution of L |
Color trichromaticity
distribution a* |
Color trichromaticity
distribution b* |
|||
value of color L |
percent of animals |
trichromaticity value |
percent of animals |
trichromaticity value |
percent of animals |
< 43 |
4 |
< 15 |
2 |
< 6 |
4 |
43–44.5 |
13 |
15–16 |
2 |
6–7 |
0 |
44.5–46.0 |
16 |
16–17 |
13 |
7–8 |
4 |
46.0–47.5 |
20 |
17–18 |
31 |
8–9 |
11 |
47.5–49.0 |
28 |
18–19 |
18 |
9–10 |
26 |
49.0–50.5 |
5 |
19–20 |
20 |
10–11 |
28 |
50.5–52.0 |
7 |
20–21 |
7 |
11–12 |
16 |
≥ 52.0 |
7 |
≥ 21 |
7 |
≥ 12 |
11 |
Table
4. Phenotypic
correlation coefficients between meat content, pH, color and the
content of protein, water and fat |
||||
Studied trait |
Number, n |
Protein content |
Water content |
Fat content |
Lean cointent – Mięsność |
80 |
0.363 |
0.012 |
–0.228 |
pH45 LD |
80 |
–0.434* |
–0.122 |
–0.284 |
pH24 LD |
80 |
–0.569** |
0.494 |
0.019 |
pH24 SM |
80 |
–0.594** |
0.515** |
0.063 |
L |
80 |
–0.107 |
0.174 |
0.298 |
a* |
80 |
–0.085 |
0.212 |
0.377 |
b* |
80 |
–0.081 |
0.207 |
0.301 |
Protein content – Zawartość białka |
80 |
1 |
–0.450 |
0.141 |
Water content – Zawartość wody |
80 |
– |
1 |
–0.388 |
Fat content – Zawartość tłuszczu |
80 |
– |
– |
1 |
*significant
correlation coefficient (P ≤ 0.05), **highly
significant correlation coefficient (P ≤ 0.01). |
||||
Table
5. Phenotypic
correlation coefficients between fleshiness, pH and color |
||||
Studied trait |
Number, n |
Cechy barwy mięsa |
||
L |
a* |
b* |
||
Mięsność |
80 |
–0.058 |
0.200 |
0.175 |
pH45 LD |
80 |
–0.049 |
0.013 |
0.002 |
pH24 LD |
80 |
–0.135 |
0.053 |
0.029 |
pH24 SM |
80 |
–0.101 |
0.061 |
0.081 |
L |
80 |
1 |
–0.029 |
0.116 |
a* |
80 |
– |
1 |
0.802** |
b* |
80 |
– |
– |
1 |
**Highly
significant correlation coefficient (P ≤ 0.01). |
||||
According to Prasow et al. [2018]Prasow, M., Babicz, M., Domaradzki, P., Skałecki, P., Litwińczuk, A., Kaliniak, A. (2018). Wartość rzeźna i jakość mięsa świń ras lokalnych w Polsce [Slaughter value and meat quality of local pig breeds in Poland]. J. Anim. Sci. Biol. Bioecon., 36(1), 5–17. https://doi.org/10.24326/jasbbx.2018.1.1 [in Polish] the nutritional value of meat is determined by its chemical composition, energy value and nutritional quality indicators. Chemical analysis of the tested meat raw material showed that the average water content was almost 73% (Table 1) and was similar to the results obtained by Prasow et al. [2018]Prasow, M., Babicz, M., Domaradzki, P., Skałecki, P., Litwińczuk, A., Kaliniak, A. (2018). Wartość rzeźna i jakość mięsa świń ras lokalnych w Polsce [Slaughter value and meat quality of local pig breeds in Poland]. J. Anim. Sci. Biol. Bioecon., 36(1), 5–17. https://doi.org/10.24326/jasbbx.2018.1.1 [in Polish]. A similar value of this parameter was noted by Chmiel et al. [2012]Chmiel, M., Słowiński, M., Dasiewicz, K., Mościcka, K. (2012). Porównanie jakości technologicznej mięsa wieprzowego zaklasyfikowanego do różnych grup jakości [Comparison of technological quality of pork classified into different quality groups]. Zesz. Probl. Post. Nauk Roln., 570, 19–29 [in Polish]. Google Scholar. The fat content in the tested material was on average 2.82% and was higher than in the pigs tested by Prasow et al. [2018]Prasow, M., Babicz, M., Domaradzki, P., Skałecki, P., Litwińczuk, A., Kaliniak, A. (2018). Wartość rzeźna i jakość mięsa świń ras lokalnych w Polsce [Slaughter value and meat quality of local pig breeds in Poland]. J. Anim. Sci. Biol. Bioecon., 36(1), 5–17. https://doi.org/10.24326/jasbbx.2018.1.1 [in Polish], but lower compared to the research by Chmiel et al. [2012]Chmiel, M., Słowiński, M., Dasiewicz, K., Mościcka, K. (2012). Porównanie jakości technologicznej mięsa wieprzowego zaklasyfikowanego do różnych grup jakości [Comparison of technological quality of pork classified into different quality groups]. Zesz. Probl. Post. Nauk Roln., 570, 19–29 [in Polish]. Google Scholar. The fat content of meat is an important indicator of its quality. Research by numerous authors [Grajewska and Bocian 2005Grajewska, S., Bocian, M. (2005). Plastyczność surowego mięsa wieprzowego jako wskaźnik jego jakości z uwzględnieniem genotypu świń RYR1 [Plasticity of raw pork as an indicator of its quality, taking into account the RYR1 genotype of pigs]. Żywność. Nauka. Technologia. Jakość, 3 (44) Supl., 38–47 [in Polish]. Google Scholar, Czarniecka-Skubina et al. 2007Czarniecka-Skubina, E., Przybylski, W., Jaworska, D., Wachowicz, I., Urbańska, I., Niemyjski, S. (2007). Charakterystyka jakości mięsa wieprzowego o zróżnicowanej zawartości tłuszczu śródmięśniowego [Characteristics of the quality of pork with a varied content of intramuscular fat]. Żywność. Nauka. Technologia. Jakość, 6(55), 285–294 [in Polish]. Google Scholar, Szulc and Skrzypczak 2015Szulc, K., Skrzypczak, E. (2015). Jakość mięsa polskich rodzimych ras świń [Meat quality of Polish native breeds of pigs]. Wiad. Zoot., 53(1), 48–57 [in Polish]. Google Scholar, Tyra and Mitka 2015Tyra, M., Mitka, I. (2015). Rola tłuszczu śródmięśniowego (IMF) w kształtowaniu parametrów jakościowych (sensorycznych) mięsa [The role of intramuscular fat (IMF) in terms of the quality (sensory) parameters of meat]. Wiad. Zoot., 53(4), 50–56 [in Polish]. Google Scholar, Prasow et al. 2018Prasow, M., Babicz, M., Domaradzki, P., Skałecki, P., Litwińczuk, A., Kaliniak, A. (2018). Wartość rzeźna i jakość mięsa świń ras lokalnych w Polsce [Slaughter value and meat quality of local pig breeds in Poland]. J. Anim. Sci. Biol. Bioecon., 36(1), 5–17. https://doi.org/10.24326/jasbbx.2018.1.1 [in Polish]] indicate an unfavorably low content of intramuscular fat in pig meat. According to Gerbens [2004]Gerbens, F. (2004). Genetic control of intramuscular fat accretion, in: Muscle development of livestock animals, eds. M.F.W. te Pas, M.E. Everts, H.P. Haagsman, 343–361. https://doi.org/10.1079/9780851998114.0343, the selection of pigs for the lean meat content in the carcass resulted in its reduction below the recommended optimum. Too little or too high its level adversely affects the color of the meat [Karamucki et al. 2005Karamucki, T., Jakubowska, M., Rybarczyk, A., Szaruga, R., Gardzielewska, J., Natalczyk-Szymkowska, W. (2005). Correlation between CIE L*a*b* scale colour parameters and some quality traits and indicates of Longissimus lumborum pork muscle when using illuminant C and observer 2° and illuminant D65 and observer 10°. Międzynarodowa Konf. Nauk. ,,Jakość surowca mięsnego. Stan obecny i perspektywy w jego doskonaleniu i przetwarzaniu'', Baranowo, 14–15.09.2005, 52–53. Google Scholar].
As reported by Czarniecka-Skubina et al. [2007]Czarniecka-Skubina, E., Przybylski, W., Jaworska, D., Wachowicz, I., Urbańska, I., Niemyjski, S. (2007). Charakterystyka jakości mięsa wieprzowego o zróżnicowanej zawartości tłuszczu śródmięśniowego [Characteristics of the quality of pork with a varied content of intramuscular fat]. Żywność. Nauka. Technologia. Jakość, 6(55), 285–294 [in Polish]. Google Scholar, meat with a high intramuscular fat content was not uniform in color. Moreover, Wajda et al. [2004]Wajda, S., Daszkiewicz, T., Winarski, R., Borzuta, K. (2004). Współzależności między zawartością tłuszczu śródmięśniowego a składem tkankowym tusz wieprzowych [Relationships between the content of intramuscular fat and the tissue composition of pig carcasses]. Rocz. Instyt. Przem. Mięs. Tłuszcz., 41, 119–129 [in Polish]. Google Scholar showed that carcasses with a high fat content are characterized by a significantly lower level of protein in the muscle tissue. Grześkowiak et al. [2009]Grześkowiak, E., Borys, A., Borzuta, K., Buczyński, J.T., Lisiak, D. (2009). Slaughter value, meat quality and back fat fatty acid profile in Zlotnicka Spotted fatteners. Anim. Sci. Pap. Rep., 27(2), 115–125. Google Scholar and Tyra [2013]Tyra, M. (2013). Zależności pomiędzy cechami użytkowości rzeźnej a zawartością tłuszczu śródmięśniowego (IMF) w mięśniu najdłuższym grzbietu krajowej populacji świń [Relationships between the slaughter performance traits and the content of intramuscular fat (IMF) in the longest dorsal muscle in the domestic pig population]. Rocz. Nauk. Zoot., 40(1), 3–14 [in Polish]. Google Scholar showed that the intramuscular fat content at the level of 2.5–3% is a necessary condition for maintaining the optimal taste and aroma of meat. On this basis, it can be concluded that the results of measuring fat in meat obtained in the tests are good. As for the protein content in the analyzed raw material, it should be noted that its value – 20.08% was similar to the results obtained by Pomianowski and Sobotka [2018]Pomianowski, J.F., Sobotka, W. (2018). Wpływ terminu przechowywania na skład chemiczny, właściwości technologiczne i sensoryczne mięsa wieprzowego [Influence of the storage date on the chemical composition, technological and sensory properties of pork]. Probl. Hig. Epidemiol., 99(4), 331–335 [in Polish]. Google Scholar, while it differed from the results obtained by Chmiel et al. [2012]Chmiel, M., Słowiński, M., Dasiewicz, K., Mościcka, K. (2012). Porównanie jakości technologicznej mięsa wieprzowego zaklasyfikowanego do różnych grup jakości [Comparison of technological quality of pork classified into different quality groups]. Zesz. Probl. Post. Nauk Roln., 570, 19–29 [in Polish]. Google Scholar and Prasow et al. [2018]Prasow, M., Babicz, M., Domaradzki, P., Skałecki, P., Litwińczuk, A., Kaliniak, A. (2018). Wartość rzeźna i jakość mięsa świń ras lokalnych w Polsce [Slaughter value and meat quality of local pig breeds in Poland]. J. Anim. Sci. Biol. Bioecon., 36(1), 5–17. https://doi.org/10.24326/jasbbx.2018.1.1 [in Polish]. In the latter studies, the percentage of protein in pork ranged between 21.8–24.54%, while in Chmiel et al. [2012]Chmiel, M., Słowiński, M., Dasiewicz, K., Mościcka, K. (2012). Porównanie jakości technologicznej mięsa wieprzowego zaklasyfikowanego do różnych grup jakości [Comparison of technological quality of pork classified into different quality groups]. Zesz. Probl. Post. Nauk Roln., 570, 19–29 [in Polish]. Google Scholar was more even and averaged 22%. Also Blicharski et al. [2013]Blicharski, T., Książek, P., Pospiech, E., Migdał, W., Jóźwik, A., Poławska, E., Lisiak, D. (2013). Aktualna wartość dietetyczna wieprzowiny, jej znaczenie w diecie i wpływ na zdrowie konsumentów [The current dietary value of pork, its importance in the diet and its impact on the health of consumers]. PZHiPTCh ,,Polsus'', Warszawa [in Polish]. Google Scholar believe that relatively high protein content in meat is desirable, if only due to the fact that protein has the ability to maintain water in meat. Water absorption is the basic parameter of meat quality, determining its technological suitability. Immediately after slaughter, it exhibits maximum water-binding capacity, which is due to its low acidity. The water-binding capacity decreases significantly with maturation. The raw material, which is characterized by low water absorption, is of worse quality and shows limited suitability for processing [Szulc and Skrzypczak 2015Szulc, K., Skrzypczak, E. (2015). Jakość mięsa polskich rodzimych ras świń [Meat quality of Polish native breeds of pigs]. Wiad. Zoot., 53(1), 48–57 [in Polish]. Google Scholar]. The worst ability to maintain own water is characterized by meat with a PSE defect [Chmiel et al. 2012Chmiel, M., Słowiński, M., Dasiewicz, K., Mościcka, K. (2012). Porównanie jakości technologicznej mięsa wieprzowego zaklasyfikowanego do różnych grup jakości [Comparison of technological quality of pork classified into different quality groups]. Zesz. Probl. Post. Nauk Roln., 570, 19–29 [in Polish]. Google Scholar].
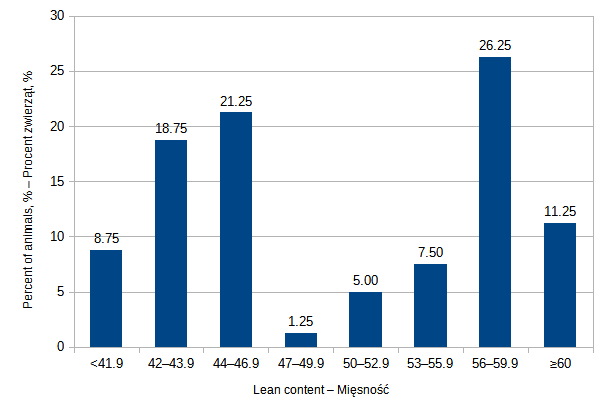
In the examined material, meat content over 50.0% was achieved by half of the slaughtered porkers (50%), of which 22.5% were animals with meat content over 60.0%. It should be noted that in the group of animals with the lowest meat content, ie below 42.0%, about 9.0% of the total slaughtered porkers were found. The meat content in the range from 42.0% to 50.0% was achieved by 41.25% of slaughtered animals (Fig. 1). In the studies by Przybylski et al. [2012]Przybylski, W., Jaworska, D., Boruszewska, K., Borejko, M., Podsiadły, W. (2012). Jakość technologiczna i sensoryczna wadliwego mięsa wieprzowego [Technological and sensory quality of defective pork]. Żywność. Nauka. Technologia. Jakość, 1(80), 116 – 127 [in Polish]. Google Scholar the studied fattening pigs were characterized by meat content above 50%. Prasow et al. [2018]Prasow, M., Babicz, M., Domaradzki, P., Skałecki, P., Litwińczuk, A., Kaliniak, A. (2018). Wartość rzeźna i jakość mięsa świń ras lokalnych w Polsce [Slaughter value and meat quality of local pig breeds in Poland]. J. Anim. Sci. Biol. Bioecon., 36(1), 5–17. https://doi.org/10.24326/jasbbx.2018.1.1 [in Polish] obtained diversified meat content of fatteners (within 44.69–59.2%), which depended on the breed of pigs.
When assessing the pH of the meat of the tested porkers according to the Pospiech criteria [2000], the presence of pH45 was found, corresponding to PSE meat in 5 carcasses (6.25%), partially PSE in 52 carcasses (65%) and normal meat in 23 carcasses (28.75%). Comparing the obtained results with the values of pH45 (≤5.8) and pH24 (>5.8) determined for PSE meat by Chmiel et al. [2012]Chmiel, M., Słowiński, M., Dasiewicz, K., Mościcka, K. (2012). Porównanie jakości technologicznej mięsa wieprzowego zaklasyfikowanego do różnych grup jakości [Comparison of technological quality of pork classified into different quality groups]. Zesz. Probl. Post. Nauk Roln., 570, 19–29 [in Polish]. Google Scholar, 20% of the studied population showed meat with PSE defect (Table 2).
The use of pH measurements in ham enables detecting other defects in the muscle tissue, e.g. meat of the DFD type. Again, there is disagreement over the determination of the pH24 limit for DFD meat. According to Pospiech [2000]Pospiech, E. (2000). Diagnozowanie odchyleń jakościowych mięsa [Diagnosing meat quality deviations]. Gosp. Mięsna, 4, 68–71 [in Polish]. Google Scholar, DFD meat has a pH24 value > 6.3, and according to Pospiech et al. [2011] The pH of 24 for this meat is 6.0. Taking into account the above criteria, the share of DFD meat in the tested material was small, 1–3% (Table 2). The obtained low prevalence of DFD meat may indicate that in the case of the analyzed material the animal welfare requirements were met.
Color brightness measurement is also used to assess the quality of meat. Many authors [Brewer et al. 2006Brewer, M. S., Novakofski, J., Freise, K. (2006). Instrumental evaluation of pH effects on ability of pork chops to bloom. Meat Sci., 72, 596–602. https://doi.org/10.1016/j.meatsci.2005.09.009, Warris et al. 2006Warris, P. D., Brown, S. N., Paściak, P. (2006). The colour of the adductor as a predictor of pork quality in the loin. Meat Sci., 73,4, 565–569. https://doi.org/10.1016/j.meatsci.2006.02.009, Strzyżewski et al. 2008Strzyżewski, T., Bilska, A., Krysztofiak, K. (2008). Zależność pomiędzy wartością pH mięsa a jego barwą [Relationship between the pH value of meat and its color]. Nauka Przyr. Technol., 2(2), 1–9 [in Polish]. Google Scholar, Chmiel et al. 2011Chmiel, M., Słowiński, M., Cal, P. (2011). Zastosowanie komputerowej analizy obrazu do wykrywania wady PSE mięsa wieprzowego [Application of computer image analysis to detect the PSE defect of pork]. Żywność. Nauka, Technologia, Jakość, 6(79), 47–54 [in Polish]. Google Scholar, 2012] showed the existing dependencies between the pH and the brightness of meat color. The results of the conducted research indicate that 60% of the animals obtained the value of the L parameter, corresponding to normal meat (Table 3).
The estimated correlations show an insignificant, but unfavorable (negative) relationship between the brightness of the meat and the protein content (r = –0.107), (Table 4) and pH45 (r = 0.049) and pH24 (r = –0.135) (Table 5). Lower and also negative correlations between the value of the L parameter and the values of pH45 and pH24 were shown in their studies by Strzyżewski et al. [2008]Strzyżewski, T., Bilska, A., Krysztofiak, K. (2008). Zależność pomiędzy wartością pH mięsa a jego barwą [Relationship between the pH value of meat and its color]. Nauka Przyr. Technol., 2(2), 1–9 [in Polish]. Google Scholar.
|
Fig. 1. The percentage distribution of meatiness in the analyzed meat processing plant |
Rys. 1. Procentowy rozkład mięsności w analizowanym zakładzie mięsnym |
Significant relationships were found between the protein content and meat pH measured, respectively in 45 minutes (r = –0.43) and in 24 hours after slaughter (r = –0.59 and r = –0.57) (Table 4). For the remaining features, the correlation values were clearly lower. Significant (r = 0.802) relationships were also obtained between the parameter value a* and b* (the value of trichromaticity coordinates).
Received: 1 Jan 1970
Accepted: 1 Jan 1970
Published online: 26 Feb 2021
Accesses: 671
Socha, S., Kozakiewicz, E., Kołodziejczyk, D., (2020). Analysis of selected parameters influencing the technological and sensory quality of pork. Acta Sci. Pol. Zootechnica, 19(4), 71–78. DOI: 10.21005/asp.2020.19.4.09.